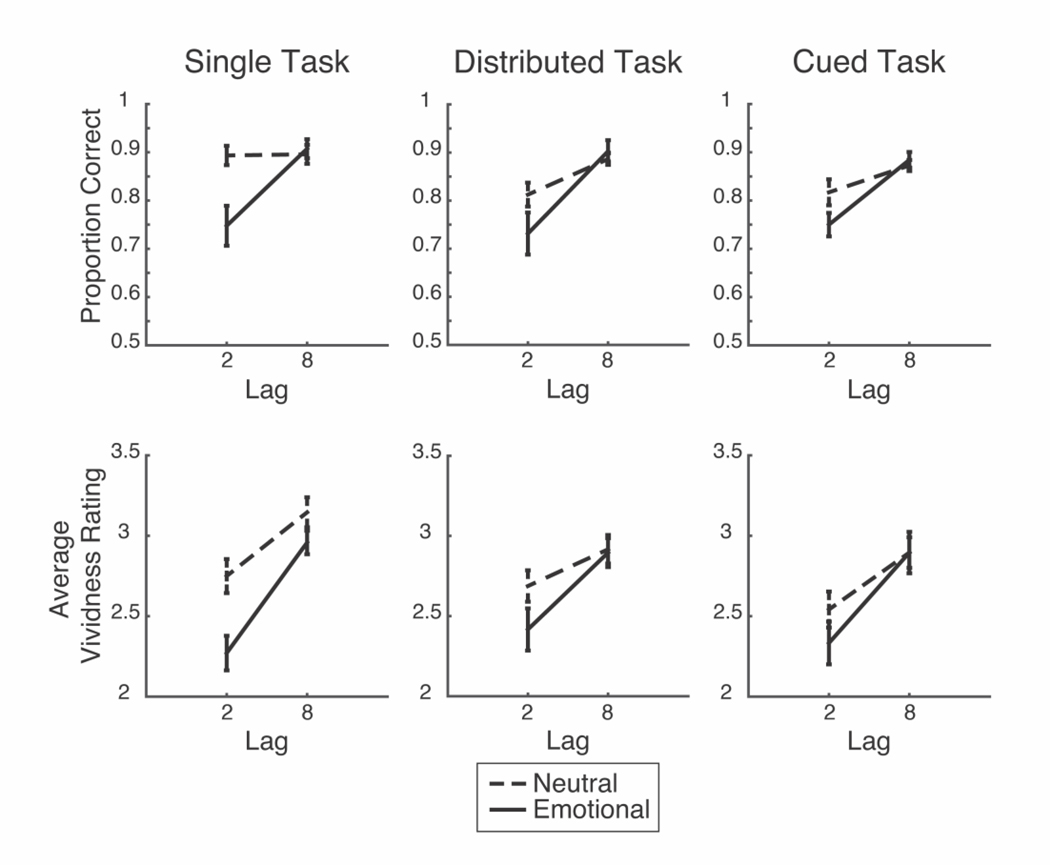
Figure 3.
The proportion of correct responses (top row) and average vividness ratings (bottom row) for the target are plotted as a function of distractor-target lag, distractor valence, and task. Ratings were assigned ordinal values: 1 = No Experience (No Exp), 2 = Brief glimpse (Brief), 3 = Almost clear experience (Almost), and 4 = Clear experience (Clear Exp). Error bars represent the standard error of the mean (SEM).

