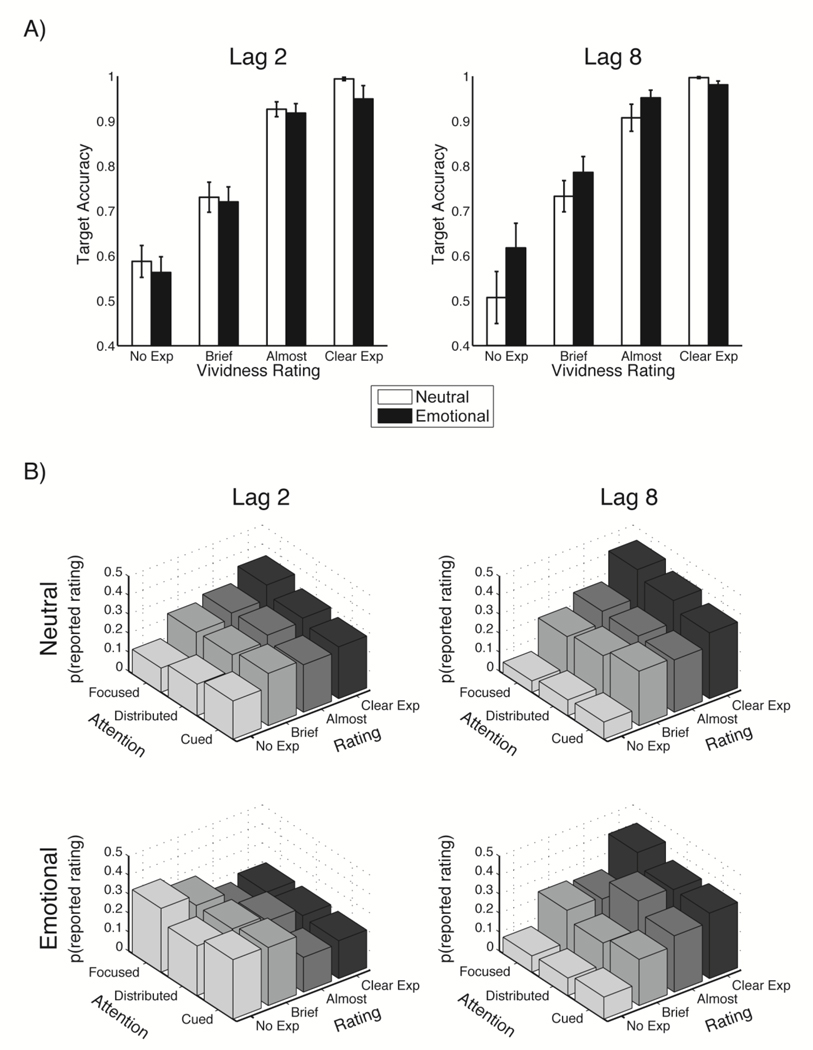
Figure 4.
A) The average proportion of correct target responses for each confidence rating for each distractor valence and lag. Error bars represent the standard error of the mean (SEM). B) The proportion of responses for each vividness rating is plotted as a function of attention task for each distractor valence (Neutral, top row; Emotional, bottom row) and lag (columns).

