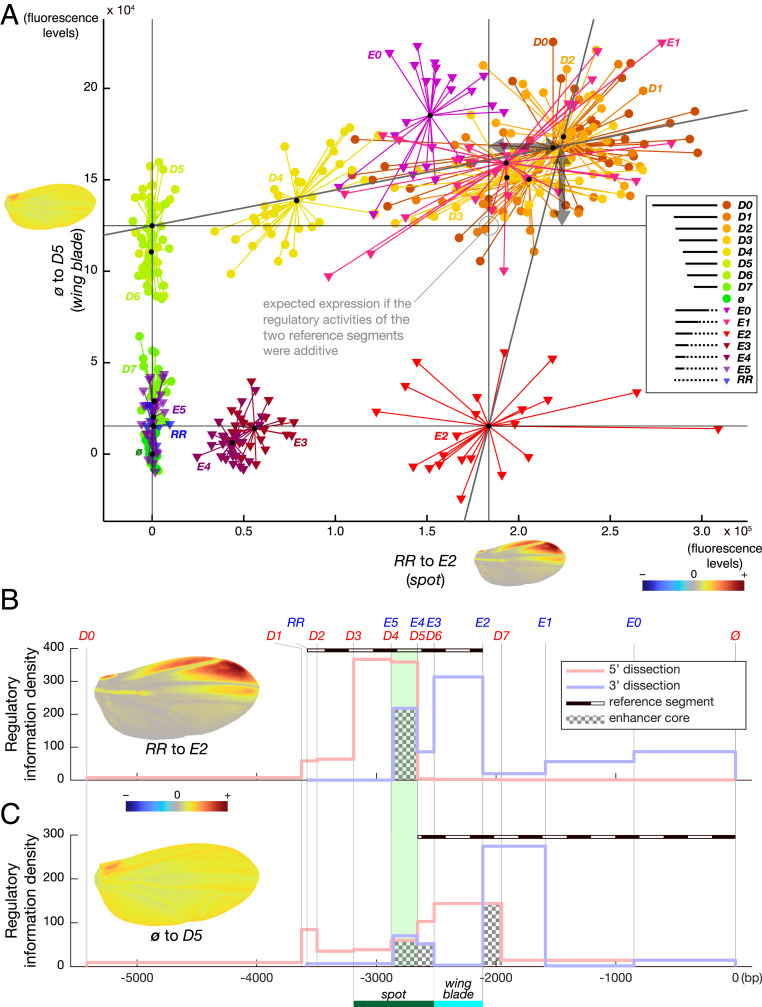
Fig. 2.
wing blade and the spot activities map to overlapping sequences. (A) Representation of wing blade activity as a function of spot activity. Independent estimates were produced by projecting the PCA phenotypic space (PCA in SI Appendix, Fig. S1A) on a two-vector basis defined by two independent directions identified in SI Appendix, Fig. S1A (phenotypic directions with color map near each axis) and corresponding to wing blade (constructs ø to D5; dotted line in B) and spot (constructs RR to E2; dotted line in C) activities. The mathematical change from the PCA coordinate basis to this two-vector coordinate basis affords the separation and independent measurements of both activities, although they occur in the same tissue. This graph shows for each individual wing (dots and triangles) of each reporter line the contribution to the wing blade and spot activities. Small black dots mark the center of a cluster for each construct. Note that constructs driving both activities (D0 to D4, E0 to E1) produce more expression than expected if the activities were strictly additive (i.e., they lie above the point of strict additivity of the activities driven by the two reference segments of the wing blade and the spot activities; the resulting nonadditive effects are shown with double arrows). (B and C) Density of regulatory information along the y 5′ region (fluorescence levels per base pair) as measured specifically (Materials and Methods) for the spot activity (B) and the wing blade activity (C). Construct boundaries are delineated with vertical gray lines labeled with the construct name on top in B and C. The original spot and wing blade boundaries (6) are indicated by a green bar and a blue bar, respectively, for comparison. Color scheme is the same as in Fig. 1. Enhancer cores, defined in the results as the intersection between the 5′ and 3′ dissection curves, are highlighted with a checkerboard pattern in B and C.

