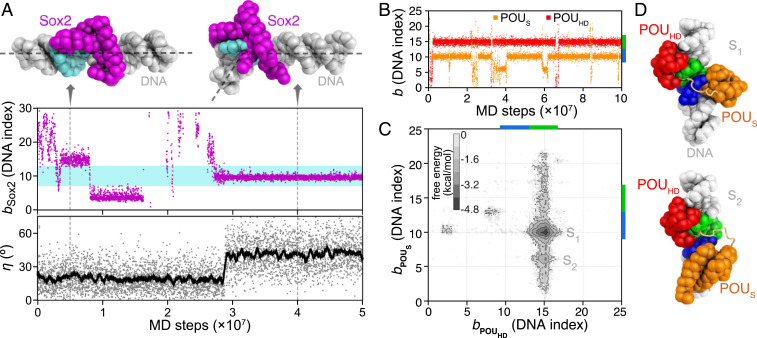
Fig. 2.
MD simulations of Sox2 and Oct4 binding to naked DNAs (see Table 1 for DNA sequences). (A) A representative trajectory of the Sox2 binding and induced bending of DNA. The DNA binding position bSox2 (see Methods for definition) of Sox2 (purple dots in Middle) and the bending angle η of DNA (see SI Appendix, Supplementary Methods for definition; gray dots in Lower) are plotted as functions of MD steps. The cyan region in Middle (DNA indices 7 to 13) represents the consensus sequence for Sox2 binding. The black line in Lower is the moving average of the DNA bending angle data. (Upper) Snapshots of Sox2-DNA sequence-nonspecific (Left, MD step ) and specific binding (Right, MD step ). The dashed lines on the structures show the direction of DNA double helix axes. (B) Representative time series of the Oct4 POUS (orange) and POUHD (red) binding positions on DNA. The consensus sequences for POUS and POUHD are marked by blue and green bars on the right vertical axis. (C) The 2D free energy surface of binding positions of the POUS and POUHD domains. (D) Representative structures of the two free energy minima (S1 and S2). The color scheme of the structures is the same as Fig. 1.

