Fig. 3.
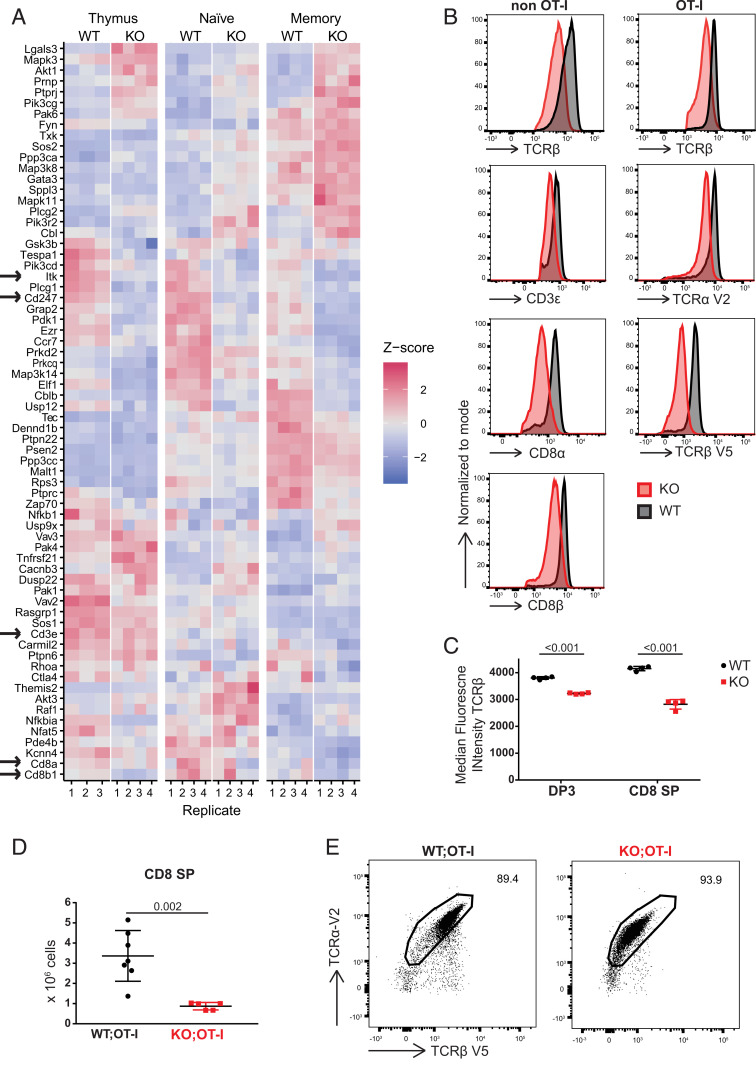
Dot1L ablation impairs TCR/CD3 expression. (A) Heatmap showing RNA expression of TCR signaling genes, defined by differential expression between WT and Dot1L-KO, in any of the sorted CD4−CD8+CD3+ thymocytes (thymus), CD44−CD62L+ (naïve) CD8+ T cells, and CD44+CD62L+ (memory) CD8+ T cells; four mice per genotype except for WT thymus where there are three mice. Genes are clustered based on Z-score. Arrows indicate genes involved in the TCR complex and Itk. Z-score is calculated row-wise within genes between samples. (B) Expression of TCRβ, CD3ε, TCRα V2, TCRβ V5, CD8α, and CD8β on CD8+ T cells in spleen from Lck-Cre;Dot1L and Lck-Cre;Dot1L;OT-I mice. (C) Median fluorescence intensity for TCRβ on DP3 and CD8+ SP thymocytes; data are from one experiment with four mice per genotype, represented as mean ± SD. (D) Absolute number of CD4−CD8+CD3+ thymocytes in WT and KO mice from Lck-Cre;Dot1L;OT-I background; data are from two individual experiments with three to four mice per genotype, represented as mean ± SD. (E) Representative plot of TCRα V2 and TCRβ V5 expression on CD8+ T cells from spleen.

