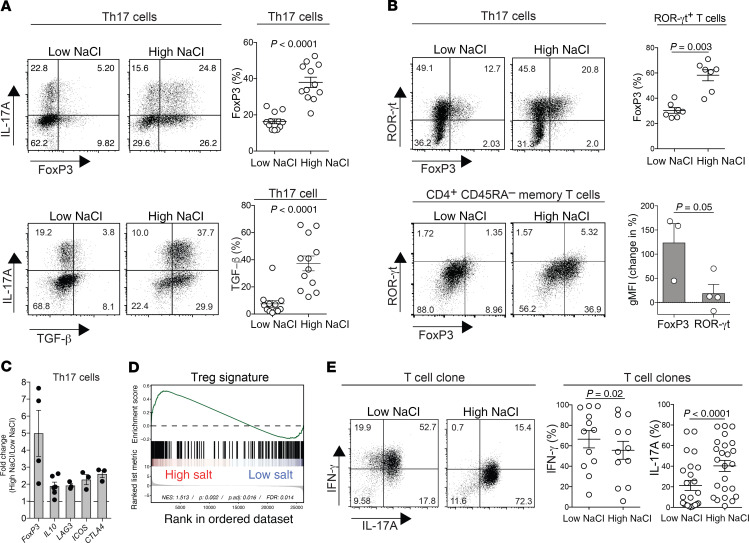
Figure 2. Human Th17 cells acquire antiinflammatory functions upon restimulation in high-NaCl conditions.
(A) CD4+CD14–CD45RA–CCR6+CCR4+CXCR3– Th17 cells were sorted by flow cytometry from fresh human PBMCs as T cells and stimulated for a total culture period of 5 days in high- or low-NaCl conditions with CD3 and CD28 mAbs (48 hours plate-bound). Results for intracellular staining and FACS analysis on day 5 following PMA and ionomycin restimulation are shown. A representative FACS plot and cumulative data with each circle representing an individual donor are shown. (B) Intracellular staining for transcription factors followed by FACS analysis of T cells isolated and stimulated for 5 days with CD3 and CD28 mAbs (48 hours plate-bound). Top panel: Circles indicate individual blood donors. Bottom panel: Change in transcription factor expression in T cells stimulated in high- versus low-NaCl conditions (n = 3–4). (C) qRT-PCR analysis of Th17 cells stimulated as in A (n = 3–6). A 2-tailed Student’s t test was performed for comparisons of high- versus low-NaCl conditions; P < 0.05 for each of the transcripts shown. (D) GSEA for Treg-associated genes (GEO GSE18893) in Th17 cells cultured in low- or high-NaCl conditions for 5 days (48 hours CD3/CD28 mAbs). (E) T cell clones were generated from CD4+CD14–CD45RA–CCR6+CCR4+CXCR3– T cells, which were enriched for Th17 cells, and then restimulated in low or high NaCl concentrations, as in A. Intracellular staining and FACS analysis are shown. A representative FACS plot and cumulative data are shown. Each circle represents a separate T cell clone. A 2-tailed Student’s t test was used for comparisons between 2 groups (A–C, and E).

