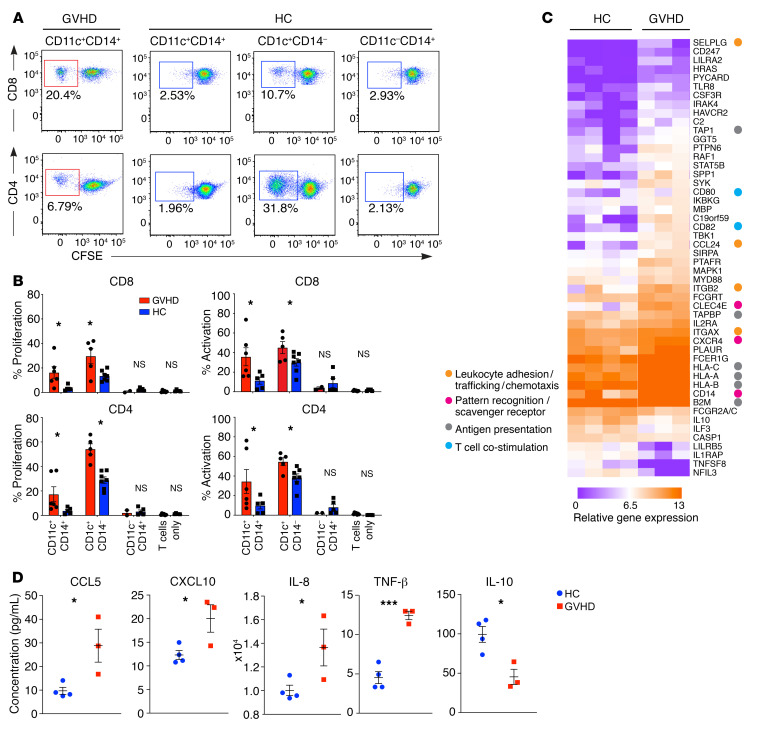
Figure 4. GVHD macrophages activate allogeneic T cells.
(A) Proliferation of allogeneic CD4+ and CD8+ cells estimated by CFSE dilution after coculture with DC and macrophage subsets sorted from GVHD or healthy controls. (B) Summary of T cell proliferation (percentage of CFSE dilution) and activation (percentage of CD69+CD8+ T cells and percentage of HLA-DR+ CD4+ T cells) from n = 3 experiments. *P < 0.05, unpaired t test. (C) Heatmap of genes differentially expressed between CD11c+CD14+ monocyte-derived macrophages sorted from healthy control skin (n = 4) and GVHD skin (n = 3) with fold difference in log2 gene expression of greater than 1.3. P < 0.05, unpaired t test. Annotations show functional attributes of genes (based on Entrez Gene summaries) upregulated in GVHD macrophages. (D) CD11c+CD14+ monocyte–derived macrophages sorted from GVHD (n = 3) and healthy control dermis (n = 4) were stimulated with LPS in culture over 10 hours. Chemokine and cytokine production were quantified in supernatants by Luminex assay. Data are represented as mean ± SEM. *P < 0.05; ***P < 0.001, unpaired t test.

