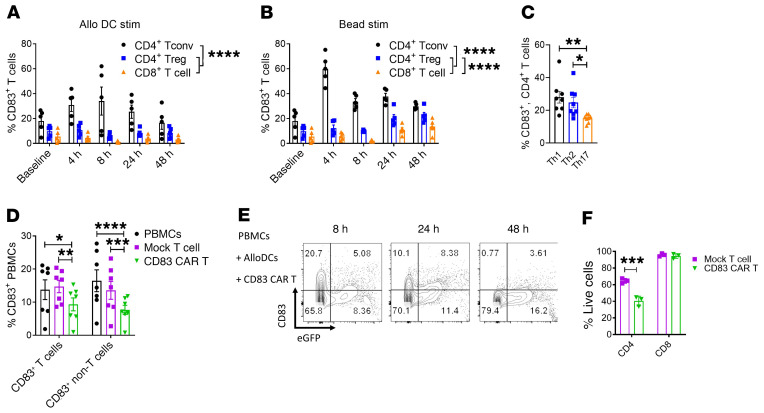
Figure 2. CD83 is differentially expressed on human activated conventional CD4+ T cells compared with regulatory T cells.
Human T cells were stimulated by allogeneic moDCs (DC/T cell ratio, 1:30) or CD3/CD28 beads (bead/T cell ratio, 1:30). CD83 expression on activated Tconvs (CD4+, CD127+, CD25+) or Tregs (CD4+, CD127–, CD25+, Foxp3+) was measured at baseline, 4 hours, 8 hours, 24 hours, and 48 hours after stimulation. Graphs show the amount of CD83+ Tconvs or Tregs (mean ± SEM) after (A) allogeneic DC or (B) CD3/CD28 bead stimulation (n = 5 independent experiments). (C) Graph shows the frequency (mean ± SEM) of CD83+ Th1 (CD4+, T-bet+), Th2 (CD4+, GATA3+), or Th17 (CD4+, RORγt+) cells after 8 hours of DC-allostimulation (n = 8 independent experiments). Human CD83 CAR or mock T cells were cultured with DC-allostimulated PBMCs at a ratio of 1:10 over 48 hours. (D) Graph shows the frequency of CD83+, CD3+, and CD3– target cells when cultured with CD83 CAR or mock-transduced T cells (n = 7 independent experiments). (E) Contour plots show the expression of CD83 among EGFP+ CAR T cells over time. One representative experiment of 2 is shown. (F) Human CD4+ or CD8+ T cells were activated with CD3/CD28 beads for 8 hours, then removed from the beads and cocultured with autologous CD83 CAR T cells or mock-transduced T cells for 24 hours (CAR T–to–T cell ratio, 5:1). Graph shows the triplicate mean ± SEM of live CD4+ or CD8+ T cells at the end of culture. One representative experiment of 2 is shown. ANOVA (A–D and F). *P < 0.05, **P = 0.001–0.01; ***P = 0.0001–0.001; ****P < 0.0001.

