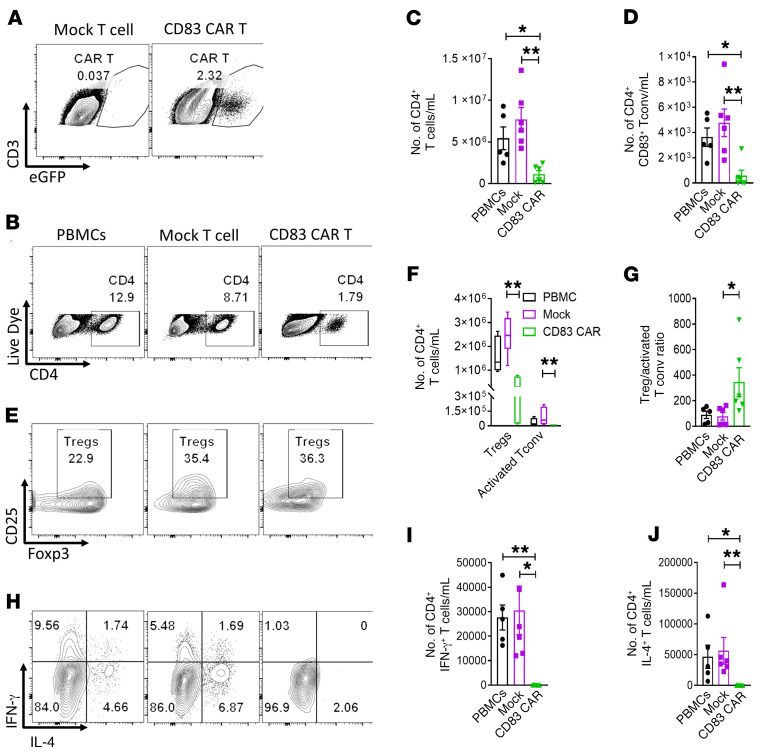
Figure 6. Human CD83-targeted CAR T cells significantly reduce CD4+ and CD83+ T cells while increasing the Treg/activated Tconv ratio in vivo.
NSG mice received 25 × 106 human PBMCs plus 1 × 10⁶ CD83 CAR or mock-transduced T cells as described. Mice were humanely euthanized on day +21 and the spleens were harvested. (A) Representative contour plots show the amount of EGFP+ CD83 CAR T cells in the inoculated mice at day +21, compared with mice that received mock-transduced T cells. (B) Representative contour plots show the frequency of human CD4+ T cells in the recipient spleens. Graphs show the absolute numbers (mean ± SEM) of (C) CD4+ and (D) CD4+ CD83+ T cells in the mouse spleens at day +21. (E) Contour plots depict the percentage of CD4+, CD127–, CD25+, Foxp3+ Tregs in the mouse spleens at day +21. Graphs show the amount (mean ± SEM) of (F) Tregs and the (G) Treg/activated Tconv ratio at day +21 in the recipient mice. (H) Contour plots depict the frequency of CD4+ IFN-γ+ Th1 cells and CD4+ IL-4+ Th2 cells in the mouse spleens at day +21. Graphs demonstrate the absolute numbers (mean ± SEM) of (I) Th1 and (J) Th2 cells in the recipient spleens. Pooled data from 2 independent experiments, up to 6 mice per experimental arm. ANOVA (C, D, F, G, I, and J). *P < 0.05, **P = 0.001–0.01.

