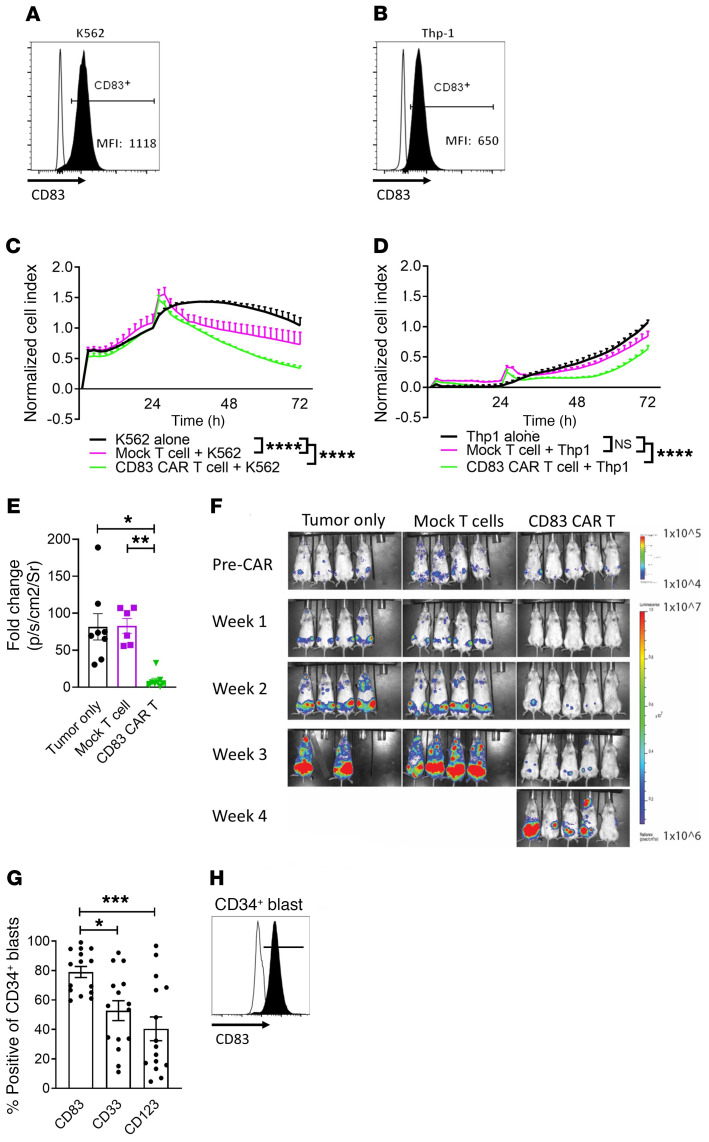
Figure 7. CD83 is a cellular target for human AML.
Histograms show CD83 expression among proliferating (A) K562 and (B) Thp-1 cells with MFI noted in the lower right-hand corner (FMO, unfilled). Human CD83 CAR or mock-transduced T cells were cocultured with fresh K562 or Thp-1 cells at an E/T ratio of 10:1. (C and D) Target cell killing was monitored using the xCELLigence RTCA system. A representative experiment for each is shown (triplicate mean ± SEM). NSG-SGM3 mice were injected with MOLM-13 EGFP/luciferase+ 1 × 10⁶ cells. Bioluminescence (BLI) was performed (IVIS Systems) on day +9 and then the mice were treated with 2.5 × 10⁶ CD83 CAR T or mock-transduced T cells. Mice were then imaged weekly. (E) Graph shows fold change (mean ± SEM) for average radiance (p/sec/cm2/Sr) at 1 week after injection of CD83 CAR or mock-transduced T cells. (F) Representative image shows weekly BLI intensities among each mouse per group over 4 weeks (n = 2 independent experiments, with 7–8 mice per experimental arm). (G) Graph shows the expression (mean ± SEM) of CD83 compared with CD33 or CD123 among freshly acquired human CD34+ AML blasts. (H) Representative histogram shows CD83 expression among human CD34+ AML blasts (FMO, unfilled) (n = 15 patient samples). ANOVA (C, D, E, and G). *P < 0.05, **P = 0.001–0.01, ***P = 0.0001–0.001, and ****P < 0.0001.

