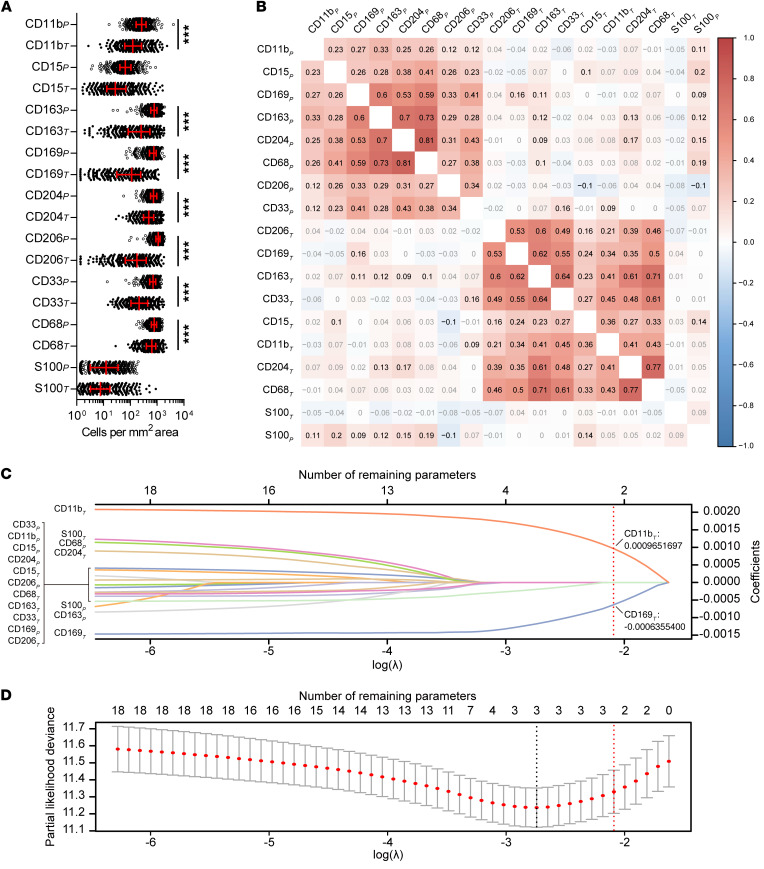
Figure 2. Construction of the MRS.
(A) Expression of 18 myeloid features (9 markers in 2 regions) in peritumor liver and intratumor tissues of HCC (n = 488). ***P < 0.001 (paired t test). Error bars, median and IQR. (B) Correlation between the 18 myeloid immune features. Correlation coefficients shown in black indicate a significant correlation (P < 0.05; Spearman rank correlation); coefficients in gray indicate an insignificant correlation (P ≥ 0.05; Spearman rank correlation). (C) Construction of the MRS using a lasso Cox model. Lasso coefficient profiles of the 18 HCC-associated myeloid features are shown. (D) Tenfold cross-validation for fine-tuning parameter selection in the lasso model. Red dots and solid gray lines represent the partial likelihood deviance ± SE. The dotted vertical lines are drawn at the optimal values by minimum criteria (black) and 1-SE criteria (red).

