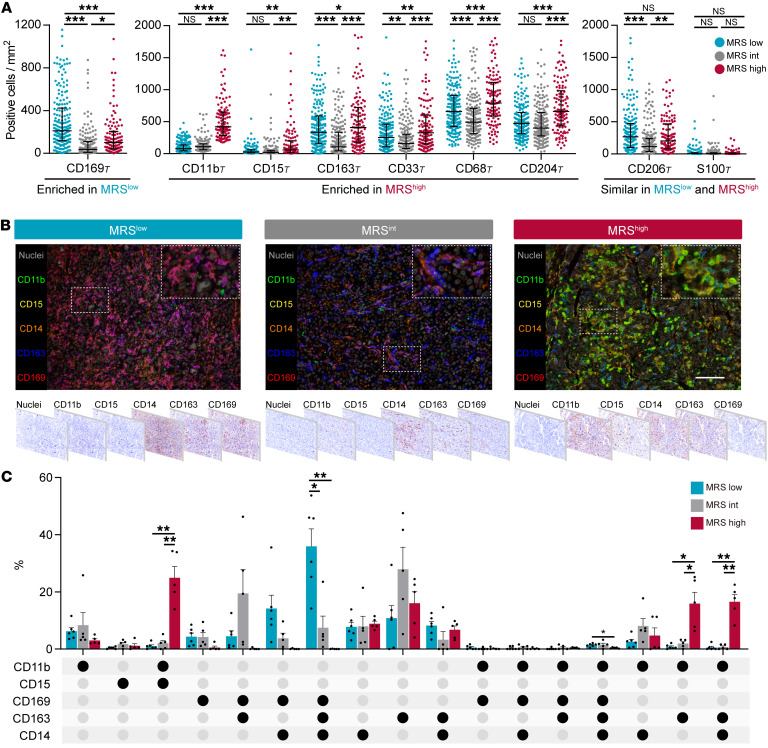
Figure 5. MRS reflects different myeloid immune contextures between HCC tumors.
(A) Densities of myeloid subsets in the intratumoral (T) area of tumors with low (n = 191), intermediate (n = 182), and high (n = 115) MRSs. Error bars, median and IQR. *P < 0.05, **P < 0.01, ***P < 0.001 (2-way ANOVA followed by Tukey’s test). (B) Representative multiplexed immunofluorescence images show different expression patterns of 5 common myeloid markers in subgroups of HCCs. Scale bar: 100 μm. (C) Different compositions of myeloid contextures in MRSlo (n = 6), MRSint (n = 5), and MRShi (n = 5) tissues. Data are shown in an UpSet plot. Each row corresponds to 1 myeloid marker, and each column (a subgroup including 3 bars) corresponds to a subset of cells with the indicated pattern of marker coexpression. Circles are either light gray, indicating that this subset was not, or was marginally, stained for that marker, or black, showing that this subset expressed that marker. Error bars, mean and SEM. *P < 0.05, **P < 0.01 (2-way ANOVA followed by Tukey’s test).

