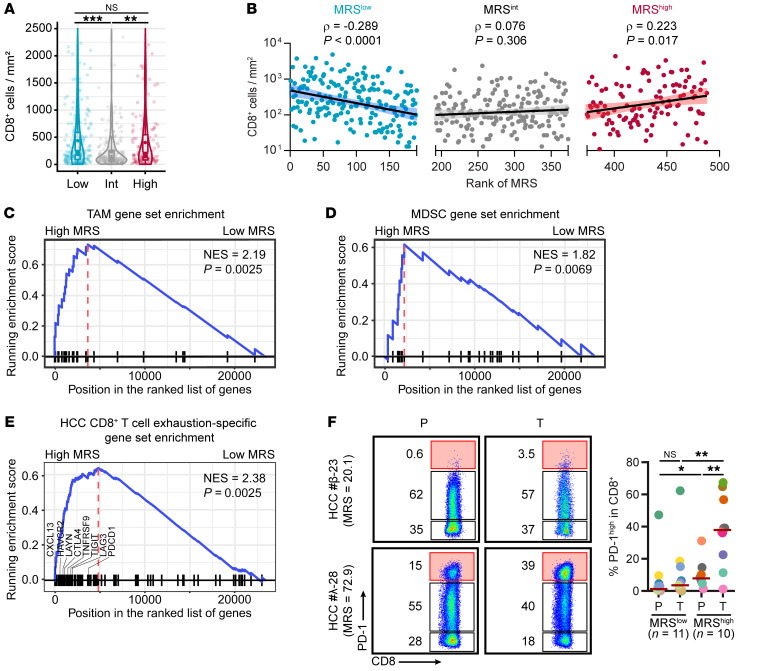
Figure 6. A high MRS indicates a more suppressive immune microenvironment.
(A) Densities of intratumoral CD8+ cells in subgroups of HCCs with low (n = 191), intermediate (n = 182), and high (n = 115) MRSs. **P < 0.01, ***P < 0.001 (ANOVA followed by Tukey’s test). (B) Correlation between MRS values and CD8+ T cell infiltration levels in HCC. Spearman’s rank correlation coefficients and P values are shown. (C–E) Enrichment of genes related to tumor-associated Mφs (TAMs) (C), MDSCs (D), and CD8+ T cell exhaustion (E) in HCCs with high MRS values. The gene sets are shown in Supplemental Table 12. The P value of the normalized enrichment score (NES) was calculated using permutation test, adjusted for multiple hypothesis testing. (F) Flow cytometric analysis of PD-1 expression on CD8+ T cells freshly isolated from HCC tissues. *P < 0.05, **P < 0.01 (Mann-Whitney test).

