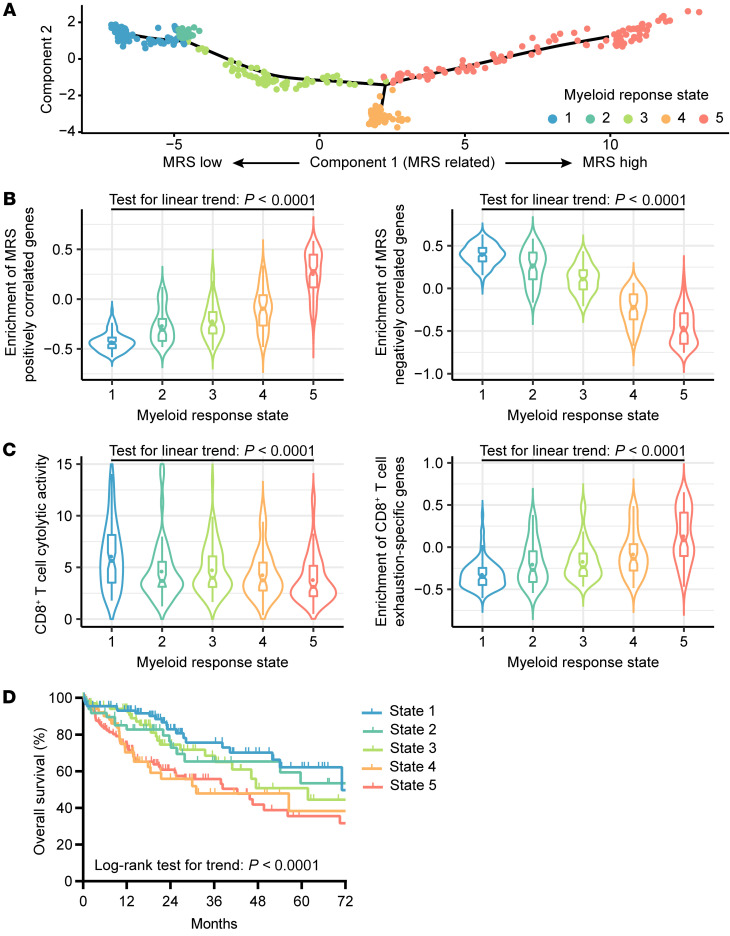
Figure 7. An increase in the MRS correlates with CD8+ T cell dysfunction and poor survival among HCC patients in the TCGA-LIHC data set.
(A) The trajectory of MRS increases along pseudotime in a 2-dimensional state-space defined by Monocle 2. The 371 HCCs from the TCGA-LIHC project are placed in the “trajectory” inferred from expression of MRS-associated differentially expressed genes (FDR < 0.01 and |logFC| > 1; Supplemental Table 11). State 1: n = 90; State 2: n = 49; State 3: n = 72; State 4: n = 52; State 5: n = 102. (B) Enrichment scores for genes positively (left) and negatively (right) correlated with MRS were determined by gene set variation analysis (GSVA). (C) Cytotoxic activity and exhaustion levels of T cells inferred from bulk RNA-Seq data. The cytotoxic activity of T cells was calculated as the geometrical mean of PRF1 and GZMA divided by the geometrical mean of CD8A and CD8B. Exhaustion levels are defined by GSVA enrichment scores for CD8+ T cell exhaustion–specific genes in HCC. (D) OS of HCC patients in subgroups of different myeloid response states.

