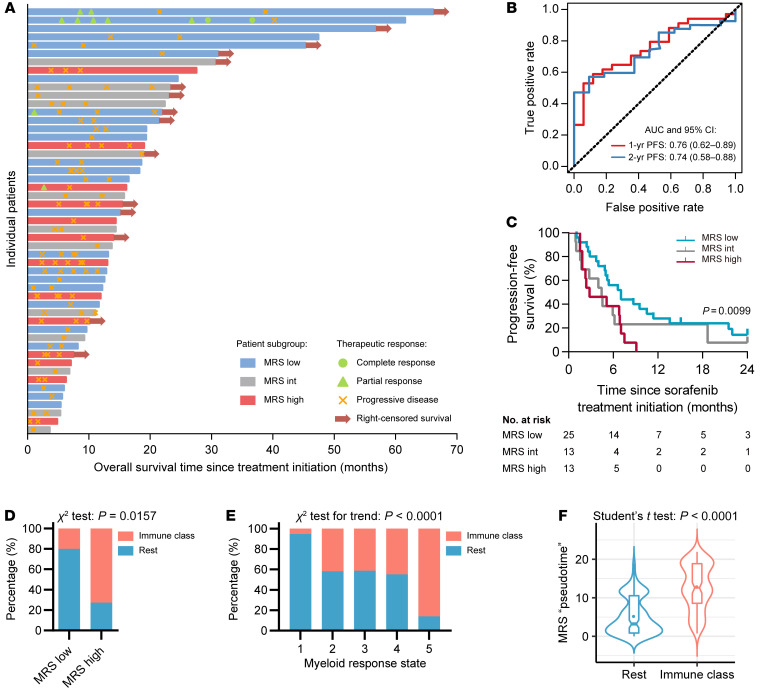
Figure 9. The association of MRS with response to sorafenib and immune class.
(A) The MRS and the response to sorafenib treatment for recurrent HCC. Individuals’ OS after sorafenib treatment initiation (diagnosed recurrence), time to response, and duration of response to sorafenib (n = 51). Patients with confirmed progressive disease received further treatment, including transcatheter arterial chemoembolization, radiofrequency ablation, or percutaneous ethanol injection. (B) ROC curve analysis of the MRS, as a continuous score, predicting the progression-free survival (PFS) of patients receiving postrecurrence sorafenib treatment. (C) Kaplan-Meier curves for PFS in different MRS subgroups are shown. The P value was calculated using the log-rank test for trend. (D) The 21 HCC samples with gene expression microarray data were classified into the immune class or the rest subgroups (see more details in Supplemental Table 14). Percentages of samples in each subgroup are shown. (E) The 371 HCC samples from the TCGA-LIHC data set were classified into the immune class or the rest subgroups (see more details in Supplemental Table 15). Percentages of samples in each subgroup are shown. (F) The virtual MRS pseudotime values in the immune class (n = 141) and the rest (n = 230) subgroups are shown.

