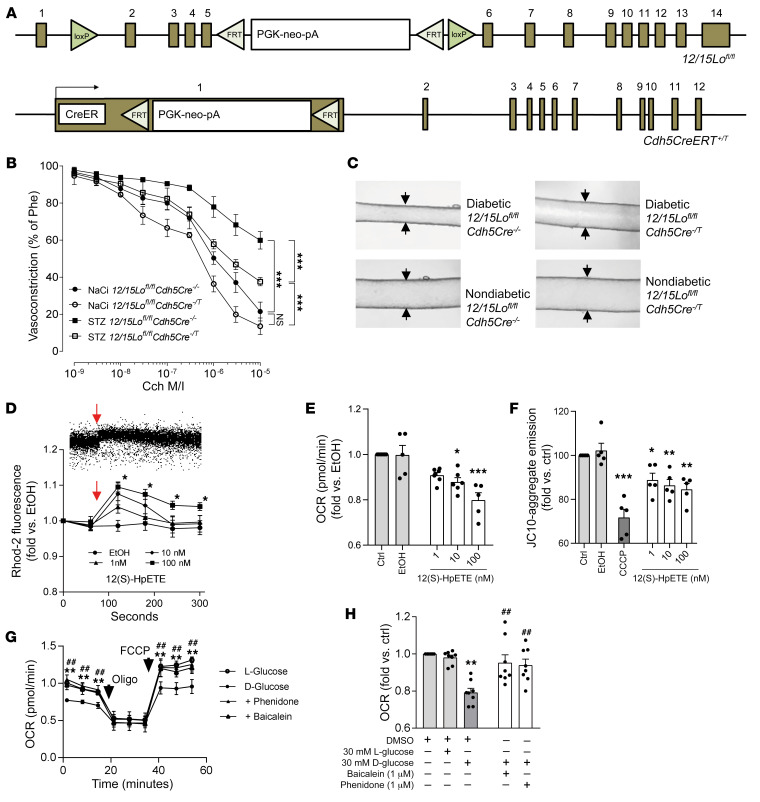
Figure 1. 12(S)-HETE mediates diabetes-induced endothelial and mitochondrial dysfunction.
(A) Mice used to generate endothelium-specific 12/15Lo knockout mice. (B) Carbamoylcholine (Cch) induced vasorelaxation in murine mesenteric resistance arteries preconstricted with 10–5 M phenylephrine (Phe) in 12/15Lofl/fl mice positive (Cre–/T) or negative (Cre–/–) for the Cre transgene. Type 1 diabetes was induced by injection of streptozotocin (STZ), dissolved in sodium citrate (NaCi) serving as vehicle control in nondiabetic mice. ***P < 0.001 vs. as indicated, 2-way ANOVA/Bonferroni. n = 5 mice per group. M/I, moles per liter. (C) Representative pictures of Cch-induced vasorelaxation at 10–5 M. (D) Mitochondrial calcium influx over time detected as fluorescence intensity changes by flow cytometry in rhodamine-2–loaded (Rhod-2–loaded) human endothelial cells stimulated with 12(S)-HpETE, with time of addition indicated by arrows. Upper panel shows a representative flow cytometry dot plot, lower panel the quantitative summary of n = 6 independent experiments. Ethanol (EtOH) served as vehicle control. *P < 0.05 vs. mean baseline, 2-way ANOVA/Bonferroni. (E) Mitochondrial respiration (oxygen consumption rate, OCR) measured by a Seahorse extracellular flux analyzer. *P < 0.05, ***P < 0.001 vs. EtOH, 1-way ANOVA/Bonferroni, n = 5–7 experiments per group. (F) Decline of mitochondrial membrane potential detected by flow cytometry as loss of red fluorescence. Two micromolar CCCP was used as positive control. *P < 0.05, **P < 0.01, ***P < 0.001 vs. EtOH, 1-way ANOVA/Bonferroni, n = 5–7 independent experiments. (G) Extracellular flux analysis of high-glucose-exposed human endothelial cells. Inhibition of 12LOX by baicalein or phenidone improves mitochondrial OCR. Maximum mitochondrial respiration was assessed after addition of oligomycin (Oligo) and FCCP, indicated by arrows. **P < 0.01 baicalein, ##P < 0.01 phenidone vs. d-glucose only, 2-way ANOVA/Bonferroni. Pooled data from n = 5–8 independent experiments with each variant each analyzed in triplicate. (H) Summary of basal respiration data. **P < 0.01 vs. l-glucose, ##P < 0.01 vs. d-glucose, 1-way ANOVA/Bonferroni, n = 8 independent experiments. All graphs show mean ± SEM.

