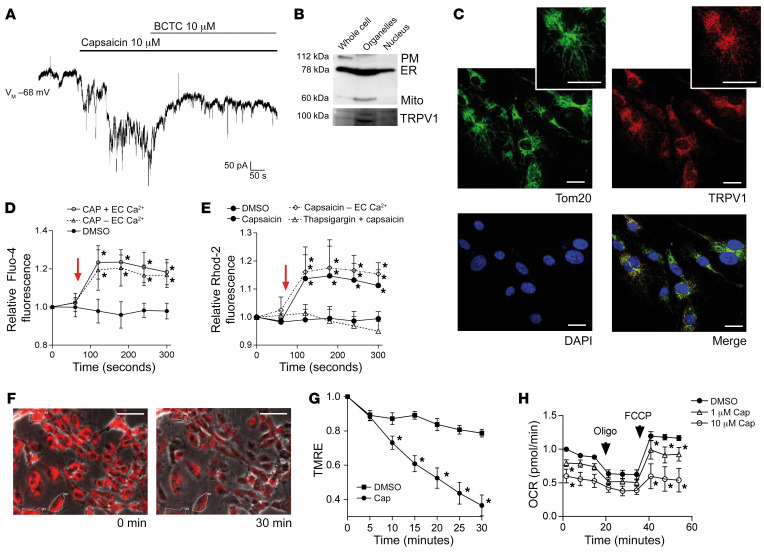
Figure 2. TRPV1, a receptor activated by 12(S)-HpETE, is present and functional in human endothelial cells, located intracellularly, and a mediator of mitochondrial dysfunction.
(A) Representative patch clamp experiment of human endothelial cell exposure to 10 μM capsaicin shows currents induced by TRPV1 activation that are antagonized by 10 μM of the TRPV1 antagonist BCTC. Representative patch of n = 15 independent experiments. (B) Cell fractionation reveals that TRPV1 is enriched in fractions containing ER (here identified by GRP78 expression) and mitochondria (Mito, ATP5a). PM, plasma membrane, Na+/K+-ATPase. (C) Immunohistochemistry showing that TRPV1 (red) colocalizes with Tom20 (green) in human endothelial cells. Cell nuclei are stained with DAPI. Scale bars: 20 μm. (D and E) Ten micromolar capsaicin (time point of addition indicated by arrow) induces increase in cytosolic calcium in Fluo-4–loaded HUVECs and increase in mitochondrial calcium in Rhod-2–loaded HUVECs independent of the presence (+ EC Ca2+) or absence (– EC Ca2+) of extracellular calcium but dependent on calcium in the ER since effects were absent after thapsigargin-induced ER depletion. *P < 0.01 vs. baseline fluorescence, 2-way ANOVA/Bonferroni, n = 6 independent experiments. (F) One micromolar capsaicin induces decline in mitochondrial membrane potential indicated as decline in fluorescence intensity of TMRE-loaded human endothelial cells during live-cell imaging. *P < 0.05 vs. baseline fluorescence intensity, 2-way ANOVA/Bonferroni, mean of at least 5 cells per high-power field in n = 5 independent experiments. Scale bars: 50 μm. (G) Prestimulation of human endothelial cells with 1 μM or 10 μM capsaicin reduces mitochondrial OCR. Maximum mitochondrial respiration was assessed after addition of oligomycin and FCCP, indicated by arrows. *P < 0.05 vs. baseline, 2-way ANOVA/Bonferroni. Pooled data from n = 5 independent experiments with each variant analyzed in triplicate. All graphs show mean ± SEM.

