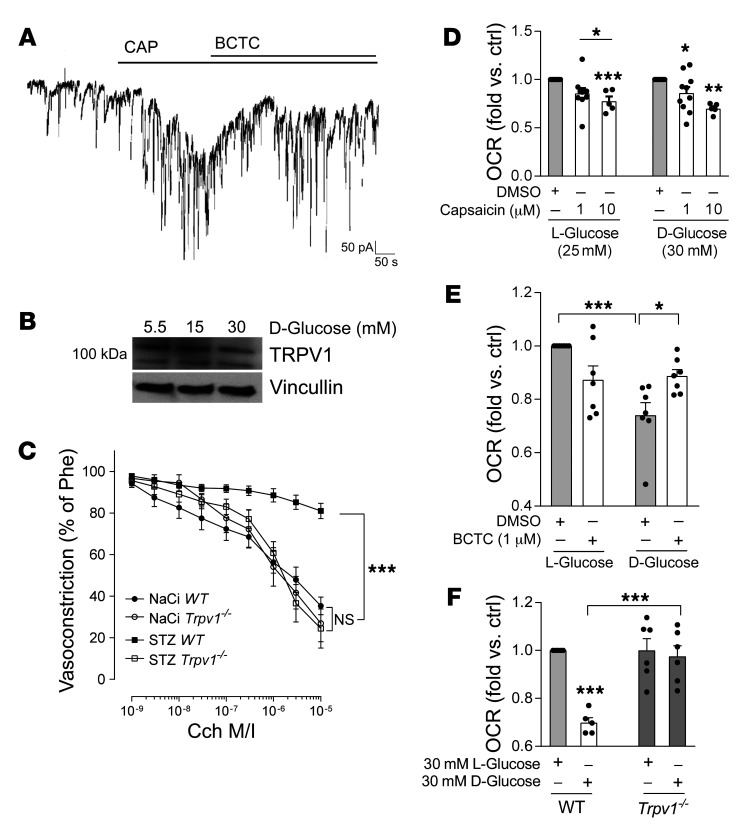
Figure 3. TRPV1 presence and function are unaltered under high-glucose conditions and TRPV1 deficiency protects against diabetes-induced endothelial dysfunction.
(A) Patch clamp experiments of human endothelial cells cultured under high levels of d-glucose (30 mM) show robust currents induced by 10 μM of capsaicin (CAP) that are antagonized by 10 μM of the TRPV1 antagonist BCTC. Representative result out of n = 10 independent experiments. (B) Representative Western blot of human endothelial cells cultured under high-glucose conditions for 24–96 hours (here 48 hours) shows that TRPV1 expression is not altered by high glucose. Twenty-five or 10 mM d-glucose was added to 5.5 mM d-glucose in media. Twenty-five or 15 mM l-glucose was added for osmotic control. (C) Cch-induced vasorelaxation in murine mesenteric resistance arteries preconstricted with 10–5 M phenylephrine shows that TRPV1-knockout (Trpv1–/–) mice are protected from diabetes-induced endothelial dysfunction. STZ, streptozotocin; NaCi, sodium citrate serving as vehicle control. ***P < 0.001 vs. as indicated, 2-way ANOVA/Bonferroni. Means were generated for each individual animal by analysis of 2 arteries, n = 10 animals per group. (D) Capsaicin reduces mitochondrial OCR in a comparable fashion in endothelial cells exposed to high levels of l- or d-glucose. *P < 0.05, **P < 0.01, ***P < 0.001 vs. DMSO or as indicated, 1-way ANOVA/Bonferroni, summary of n = 5–10 independent experiments. (E) Impaired mitochondrial respiration under high–d-glucose conditions (30 mM) in human endothelial cells is improved by coincubation with the TRPV1 antagonist BCTC. *P < 0.05, ***P < 0.001 vs. as indicated, 1-way ANOVA/Bonferroni, n = 7 independent experiments. (F) High levels of d-glucose impair mitochondrial respiration in endothelial cells isolated from WT but not Trpv1–/– mice. Endothelial cells were analyzed from n = 5–6 independent isolations. ***P < 0.001 vs. l-glucose or as indicated. All graphs show mean ± SEM.

