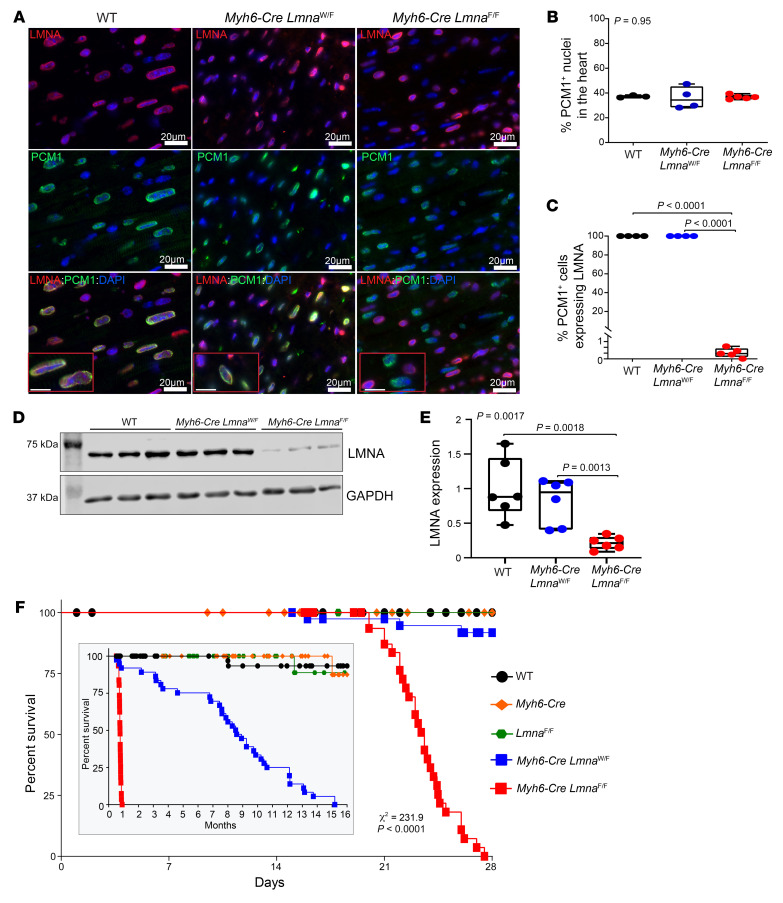
Figure 1. Conditional deletion of Lmna gene in cardiomyocytes in mice.
(A) Representative immunofluorescence staining of thin myocardial section from 3-week-old WT, Myh6-Cre LmnaW/F, and Myh6-Cre LmnaF/F mice showing localization of LMNA (red) at the nuclear membrane in PCM1-labeled (green) cardiomyocytes. Nuclei were counterstained with DAPI (blue). Scale bars: 20 μm, 10 μm (insets). (B) Quantitative data of PCM1-labeled nuclei in WT (n = 3), Myh6-Cre LmnaW/F (n = 4), and Myh6-Cre LmnaF/F (n = 5, P = 0.95). (C) Quantitative data of PCM1-labeled nuclei showing expression of LMNA in WT, Myh6-Cre LmnaW/F, and Myh6-Cre LmnaF/F (n = 5, P < 0.0001). (D) Western blots showing expression of LMNA in isolated cardiomyocyte cell lysates in 2-week-old WT, Myh6-Cre LmnaW/F, and Myh6-Cre LmnaF/F and the corresponding GAPDH as a loading control. (E) Quantitative data on LMNA expression levels in cardiomyocytes in WT (n = 6), Myh6-Cre LmnaW/F (n = 6), and Myh6-Cre LmnaF/F mice (n = 6, P = 0.0017). (F) Kaplan-Meier curve showing the survival of WT (n = 52), Myh6-Cre (n = 38), LmnaF/F (n = 50), Myh6-Cre LmnaW/F (n = 40), and Myh6-Cre LmnaF/F (n = 37) mice during the first 4 weeks (χ2 = 231, P < 0.0001) and 16 months (inset; χ2 = 344, P < 0.0001) after birth. P values shown in B, C, and E were calculated by 1-way ANOVA followed by Tukey’s post hoc pairwise comparison test.

