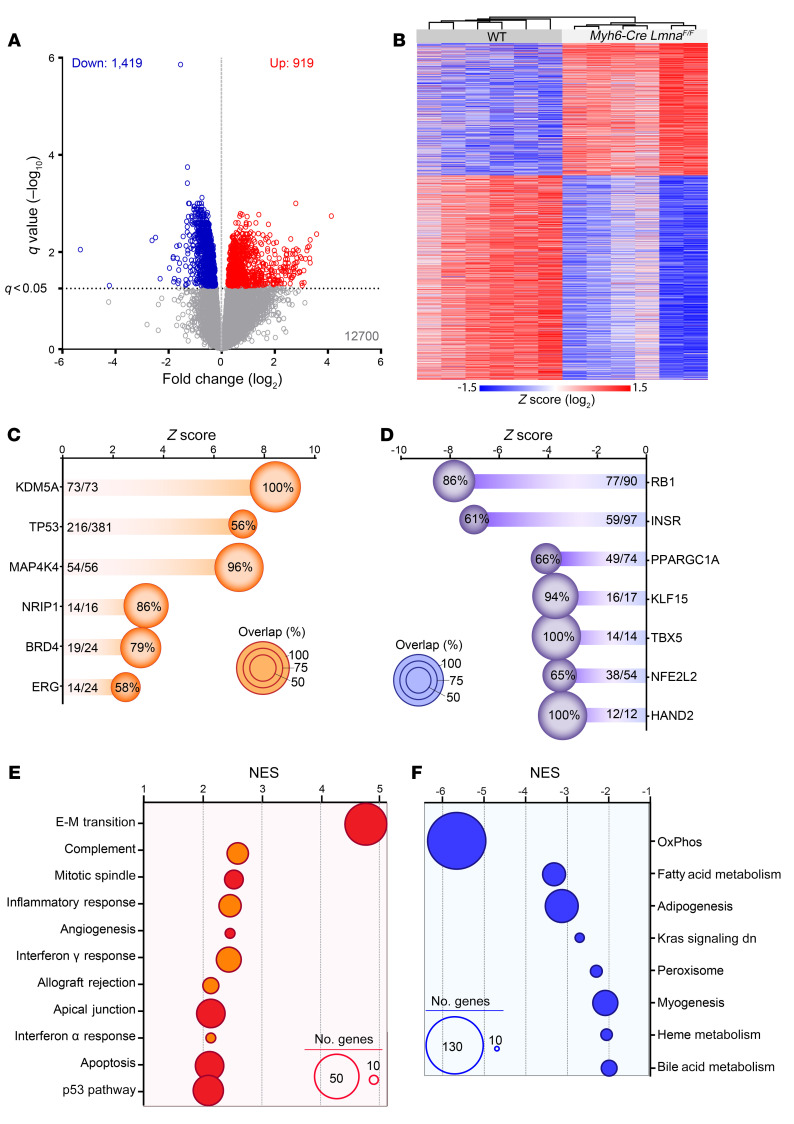
Figure 3. Differentially expressed genes in 2-week-old WT and Myh6-Cre LmnaF/F mouse cardiomyocytes.
(A) Volcano plot depicting differentially expressed genes (DEGs) showing downregulation of 1419 and upregulation of 919 genes in Myh6-Cre LmnaF/F (n = 6) compared with WT mouse cardiomyocytes (n = 6). (B) Heatmap and unsupervised hierarchical clustering of the DEGs in WT and Myh6-Cre LmnaF/F mouse cardiomyocytes, showing clustering according to the genotype. (C and D) Ingenuity Pathway Analysis (IPA) for inferred activated (C) and suppressed (D) upstream regulators of the DEGs in Myh6-Cre LmnaF/F mouse cardiomyocytes. Z score and percentage of overlap of the DEGs with the IPA database are depicted on the graphs. The size of each circle is proportional to the percentage of genes considered as downstream targets of each regulator in the RNA-Seq data set. (E and F) Top significantly enriched hallmark pathways activated (E) or inhibited (F), inferred using Gene Set Enrichment Analysis (GSEA). Normalized enrichment score (NES) and number of genes involved (size of the circle) are depicted for each pathway.

