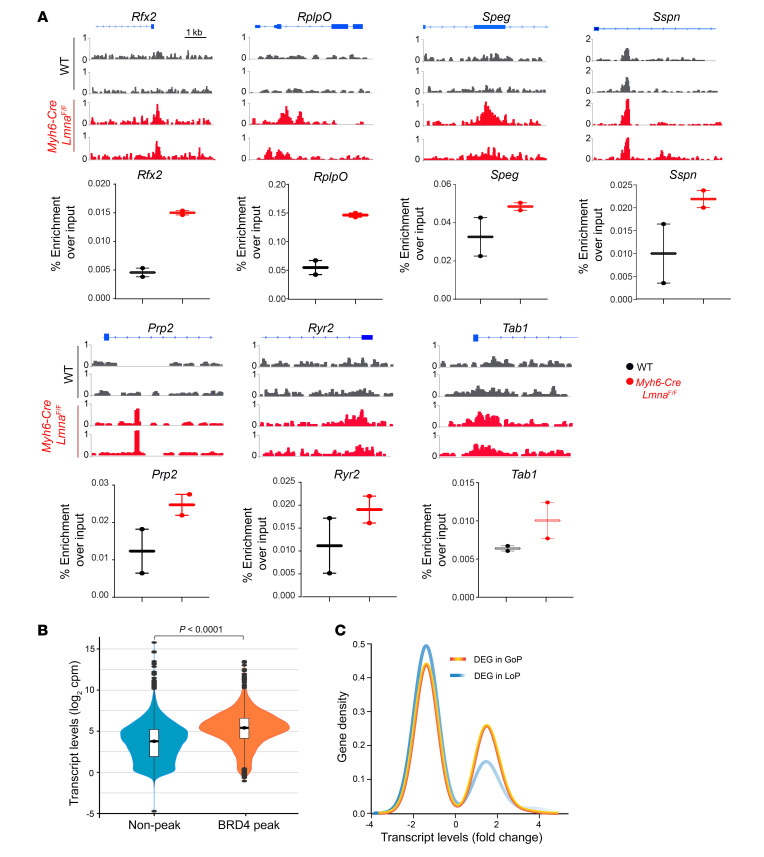
Figure 5. BRD4 activation in Myh6-Cre LmnaF/F mouse cardiomyocytes.
(A) ChIP-qPCR in WT and Myh6-Cre LmnaF/F mouse cardiomyocyte chromatin extracts (n = 2 for each genotype) and IGV tracks from ChIP-Seq showing BRD4 enrichment in the corresponding regions assessed. (B) Violin plots depicting transcript levels of all genes at nonpeak and BRD4 peak regions in Myh6-Cre LmnaF/F mouse cardiomyocytes (P < 0.0001 by Kruskal-Wallis). (C) Transcript levels of DEGs plotted against gene density at the GoP and LoP genomic regions, showing a higher density of genes with increased transcript levels in the GoP regions.

