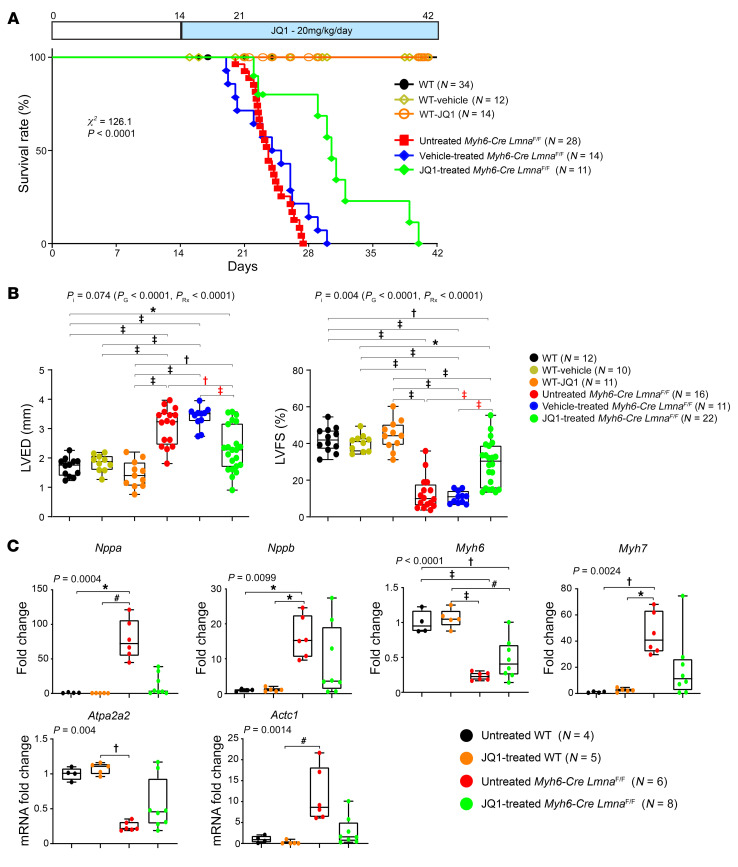
Figure 8. Phenotypic effects of BET bromodomain protein inhibition in Myh6-Cre LmnaF/F mice.
(A) Kaplan-Meier survival curves in the untreated (black line; n = 34), vehicle-treated (yellow line; n = 12), and JQ1-treated WT (orange line; n = 14), as well as untreated (red line; n = 28), vehicle-treated (blue line; n = 14), and JQ1-treated Myh6-Cre LmnaF/F (green line; n = 11), mice. (B) Selected echocardiographic parameters after 1 week of treatment in 3-week-old untreated (black dots; n = 12), vehicle-treated (yellow dots; n = 10), and JQ1-treated WT (orange dots; n = 11), as well as untreated (red dots; n = 16), vehicle-treated (blue dots; n = 11), and JQ1-treated (green dots; n = 22) Myh6-Cre LmnaF/F, mice. P values shown were obtained using 2-way ANOVA and Bonferroni’s post hoc test for comparisons; *P < 0.05, †P < 0.01, #P < 0.001, ‡P < 0.0001. PI, P value for interaction; PG, P value for genotype, PRx, P value for treatment effect. (C) Expression levels of known markers of cardiac dysfunction, quantified by RT-qPCR, after 1 week of treatment in 3-week-old untreated (black dots; n = 4) and JQ1-treated WT (orange dots; n = 5) mice, as well as untreated (red dots; n = 6) and JQ1-treated (green dots; n = 8) Myh6-Cre LmnaF/F mice. Because untreated and vehicle-treated mice were indistinguishable, only untreated and JQ1-treated mice were analyzed. P values shown were obtained with ordinary 1-way ANOVA or Kruskal-Wallis; *P < 0.05, †P < 0.01, #P < 0.001, ‡P < 0.0001.

