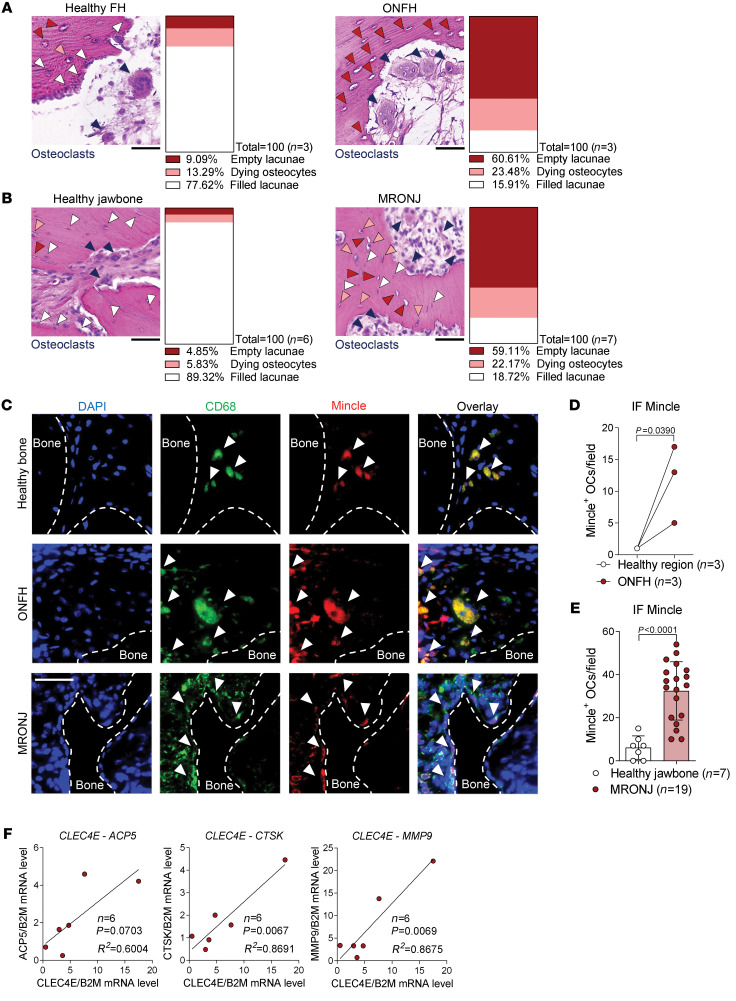
Figure 9. Mincle-positive osteoclasts are upregulated in osteonecrotic human bone lesions.
Representative pictures of H&E staining and quantification of filled lacunae (white arrows), dying osteocytes (orange arrows), and empty lacunae (red arrows) in (A) osteonecrosis of the femoral head (ONFH) lesions (n = 3/group) and (B) medication-related osteonecrosis of the jaw (MRONJ) lesions (n = 6–7/group), compared with the corresponding healthy bone areas. Dark blue arrows indicate polynucleated osteoclasts. Scale bar: 50 μm. (C) Immunofluorescence (IF) staining of CD68 (green) and Mincle (red) and DAPI staining (blue) (white arrows show CD68+Mincle+ cells near the bone surface) in ONFH and MRONJ, compared with healthy regions. Scale bar: 50 μm. (D) Quantification of Mincle-positive osteoclasts (OCs) per field in ONFH, compared with healthy region (n = 3/group). (E) Quantification of Mincle-positive osteoclasts per field in MRONJ, compared with healthy jawbone (n = 7–19/group). (F) Correlation analyses between the mRNA expression of CLEC4E and the osteoclast markers ACP5, CTSK, and MMP9 in MRONJ samples (n = 6). Data are shown as mean ± SD. P values were determined by 2-tailed Student’s t test for single comparisons (D and E) and correlations were tested with the linear regression F test (F).

