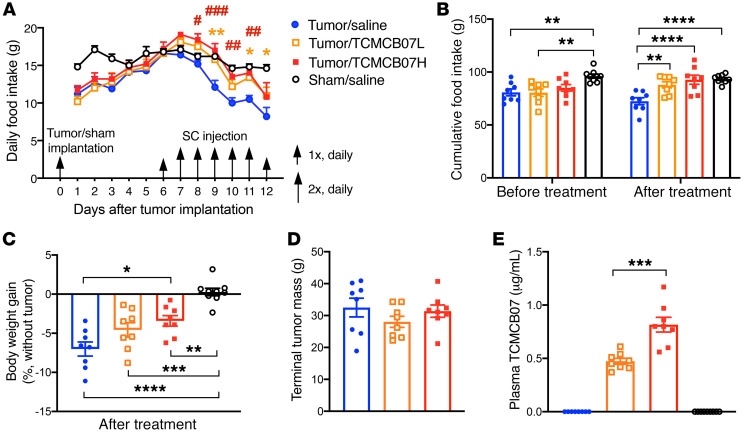
Figure 4. Administration of TCMCB07 s.c. ameliorates anorexia and body weight loss in rats with cancer cachexia.
(A) Daily food intake in tumor/saline group (n = 8) versus tumor/TCMCB07L (low dose) group (n = 8), tumor/TCMCB07H (high dose) group (n = 8), and sham/saline group (n = 9) after tumor implantation or sham operation. Rats received s.c. injection once (1×) or twice (2×) daily with saline or TCMCB07L (1.5 mg/kg/d) or TCMCB07H (3 mg/kg/d) between day 6 and day 12 after implantation. (B) Cumulative food intake before and after treatment. (C) Body weight gain after treatment (%, tumor-free net gain normalized to baseline of day 6). (D) Tumors were dissected and weighed after animals were euthanized on day 12. (E) Terminal plasma TCMCB07 concentrations were measured by reverse-phase HPLC. All data in A are expressed as mean ± SEM for each group, and all data in B–E are expressed with each dot representing 1 sample. Two-way ANOVA in A and for sham/saline group was excluded for 2-way ANOVA analysis in order to clearly show a treatment comparison among 3 tumor groups (tumor/saline, tumor/TCMCB07L, tumor/TCMCB07H) (A). *P < 0.05; **P < 0.01; ***P < 0.001; ****P < 0.0001; #P < 0.05; ##P < 0.01; ###P < 0.001, 1-way ANOVA (B–D); unpaired Student’s t test (E). Yellow asterisks in A show tumor/TCMCB07L group versus tumor/saline group, and red pound signs in A show tumor/TCMCB07H group versus tumor/saline group.

