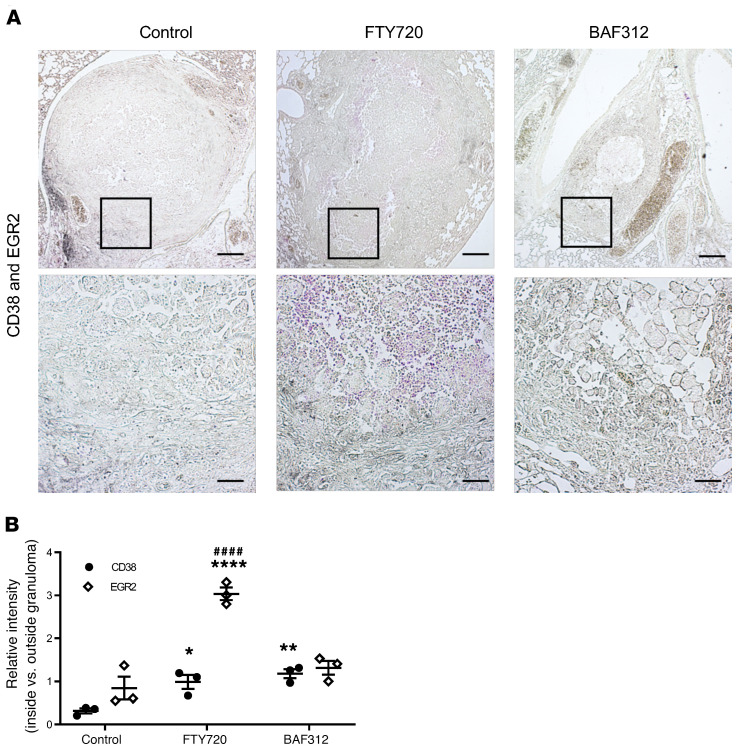
Figure 6. Treatment with FTY720 but not BAF312 affects M2 macrophage polarization in the granuloma structure.
(A) Mice were infected for 30 days with C. neoformans Δgcs1 before FTY720, BAF312, or vehicle control (H2O) administration. At day 60 after compound administration, lungs were processed for CD38 (gray) and EGR2 (magenta) immunohistochemistry to assess for M1 and M2 macrophage polarization, respectively. Scale bars: 200 μm (top), 50 μm (bottom). (B) The relative intensity of CD38 and EGR2 staining inside versus outside the bounds of the granuloma, as delineated by the collagen deposition seen in VVG of Figure 5, was quantified using Image J software, n = 3. All error bars represent SEM. Comparisons were done with 2-way ANOVA with Bonferroni’s multiple comparisons post hoc test. P value was corrected for multiplicity using Bonferroni’s adjustment. *P = 0.0393, **P = 0.0084, ****P < 0.0001 compared with the control. ####P < 0.0001 compared with BAF312.

