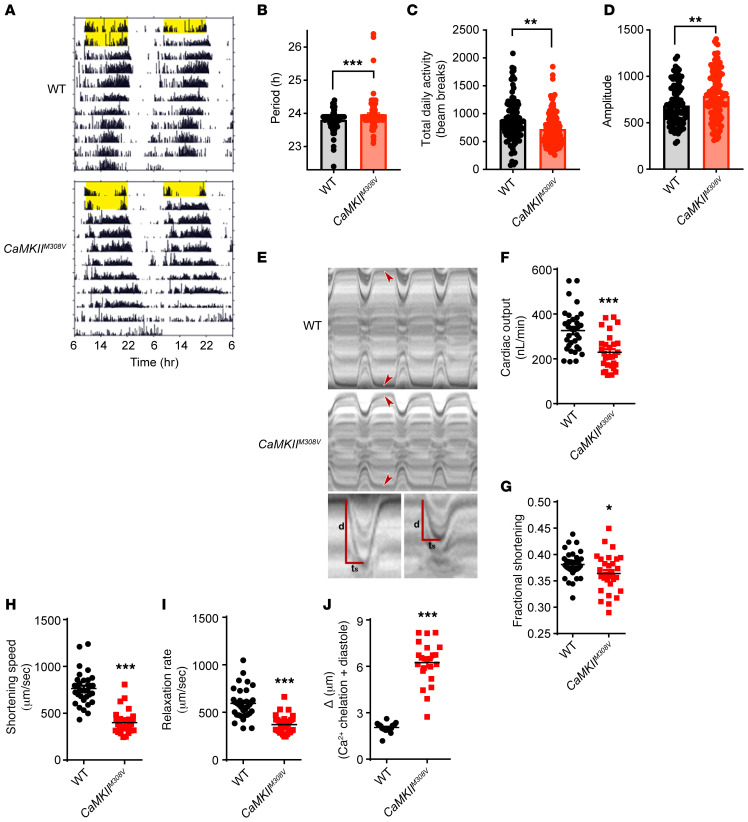
Figure 5. M308 determines circadian rhythms and heart tube physiology in Drosophila melanogaster.
(A) Representative actograms of WT and CaMKIIM308V flies. Actograms are double plotted with yellow bars representing light exposure. (B) CaMKIIM308V flies have a significantly longer free-running circadian period, as estimated by χ2 periodogram (WT n = 99, CaMKIIM308V n = 120). Bars denote mean ± SEM. (C) CaMKIIM308V flies exhibit significantly decreased average daily locomotion during constant darkness, as measured by beam-break counts per day (WT n = 99, CaMKIIM308V n = 120). Bars denote mean ± SEM. (D) Circadian χ2 amplitude indicates increased rhythm strength of CaMKIIM308V flies under constant darkness (WT n = 99, CaMKIIM308V n = 120). Bars denote mean ± SEM. (E) Representative M-mode kymograms generated from high-speed videos of beating WT and CaMKIIM308V fly heart tubes. Top panel shows cardiac cycle dynamics and heart wall contraction over time. Bottom panel shows individual systolic intervals of WT and CaMKIIM308V flies. CaMKIIM308V flies exhibit reduced wall movement distance (d) during systole and a prolonged time of shortening (ts) resulting in significantly diminished shortening speed. (F–I) CaMKIIM308V flies have markedly impaired heart function compared with WT flies. CaMKIIM308V flies at baseline exhibit (F) decreased cardiac output, (G) decreased fractional shortening, (H) decreased shortening speed, and (I) decreased relaxation rate (WT n = 33, CaMKIIM308V n = 30). (J) CaMKIIM308V heart tube diastolic diameter is markedly increased after intracellular Ca2+ chelation with EGTA-AM compared with WT heart tubes (WT n = 20, CaMKIIM308V n = 23). *P < 0.05, **P < 0.01, ***P < 0.001 by 2-tailed Student’s t test (B–D and F–I) or 2-tailed Mann-Whitney test (J).

