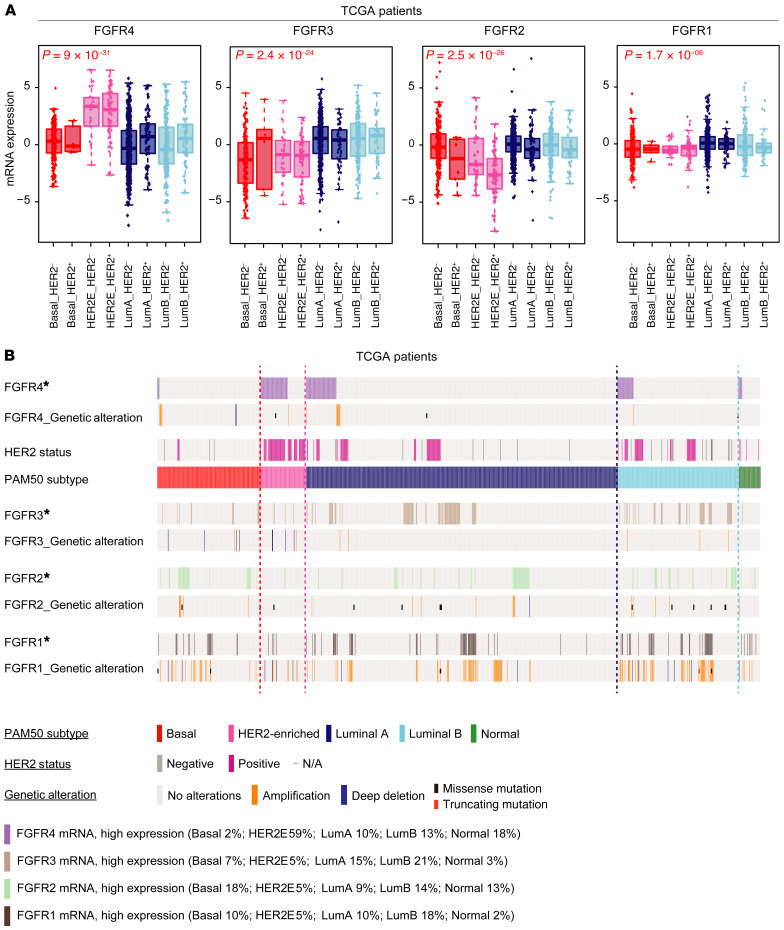
Figure 1. Comparative genetic and transcriptomic analysis of FGFR4 family members in TCGA.
(A) Box-and-whisker plots of FGFR family gene expression levels by mRNAseq according to molecular subtype and HER2 status by IHC. Tumors without clinical data for HER2 status and normal-like samples have been removed from the analysis, resulting in 1028 patients. Box-and-whisker plots display the median value on each bar, showing the lower and upper quartile range of the data and data outliers. The whiskers represent the interquartile range. Comparison between more than 2 groups was performed by ANOVA. Statistically significant values are highlighted in red. Each mark represents the value of a single sample. (B) Oncoprint diagram depicting high mRNA gene expression, DNA copy-number alterations, and mutations of FGFR family genes. *FGFR mRNA, high expression: high expression of genes was considered where levels exceeded the third quartile of positive values of gene expression (normalized, log2-transformed, and median-centered RNAseq data). Putative copy-number calls on 1077 cases were determined using GISTIC 2.0 (84). Deep deletion: –2 (homozygous deletion); amplification: 2 (high-level amplification). Mutation types are defined only as missense mutations (single base pair) or truncating mutations (multiple base pairs). HER2 clinical status was defined as previously described (85). LumA, luminal A; LumB, luminal B.

