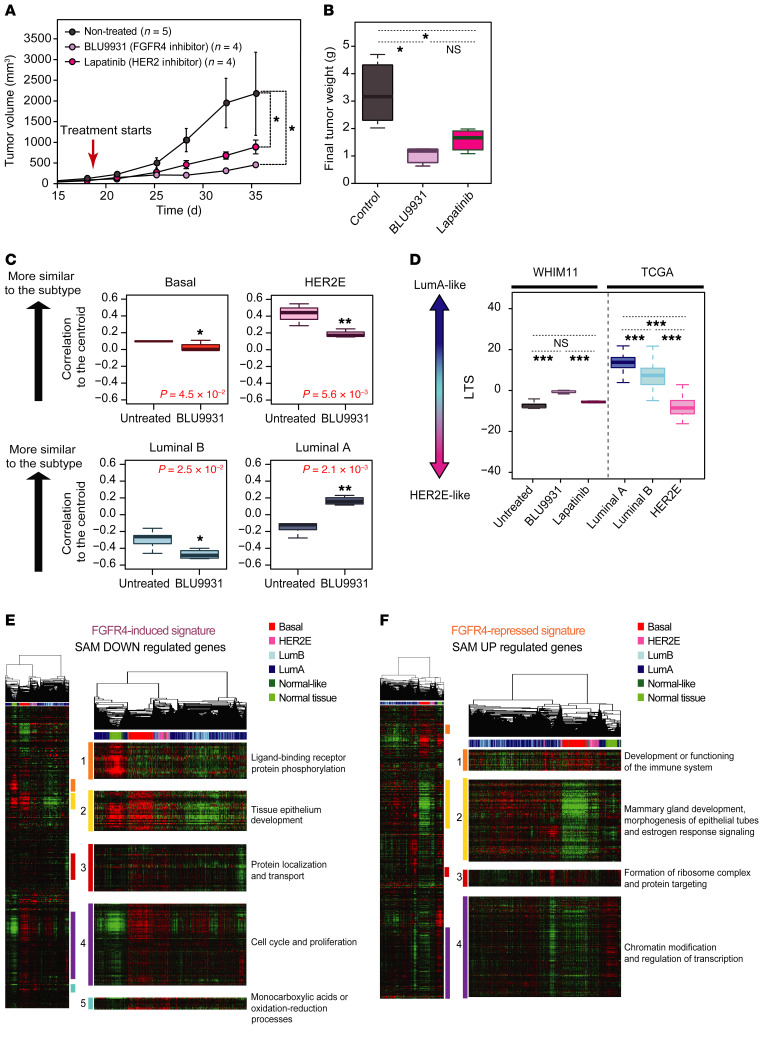
Figure 2. Testing the impact of FGFR4 on tumor growth and tumor differentiation in a HER2E/cHER2– PDX (WHIM11).
(A) Tumor growth and (B) tumor weight of WHIM11 tumors treated with BLU9931 (0.6 g/kg/day) or lapatinib (1.833 g/kg/day) for approximately 18 days (5 animals per treatment arm). Data represent mean tumor volume ± SEM. (C) Correlation to the PAM50 centroids (basal, HER2E, luminal A, luminal B) of mice treated with BLU9931 and untreated mice. (D) BLU9931-treated, lapatinib-treated, or untreated tumors evaluated for a luminal tumor score (LTS) tested along with TGCA cohort grouped according to intrinsic subtype. (E and F) Supervised hierarchical cluster across 1100 breast tumors and 98 normal samples from TCGA data set using FGFR4-related signatures. Significantly upregulated genes defined as an FGFR4-repressed signature (E) and significantly downregulated genes defined as a FGFR4-induced signature (F). Each gene set or subcluster has been selected based on a node correlation greater than 0.5 and named according to the important biological process governed by it as identified by Gene Ontology. Comparison between more than 2 groups was performed by ANOVA with post hoc Tukey’s test: *P < 0.05; **P < 0.01; ***P < 0.001. Statistically significant values are highlighted in red. Box-and-whisker plots display the median value on each bar, showing the lower and upper quartile range of the data. The whiskers represent the interquartile range.

