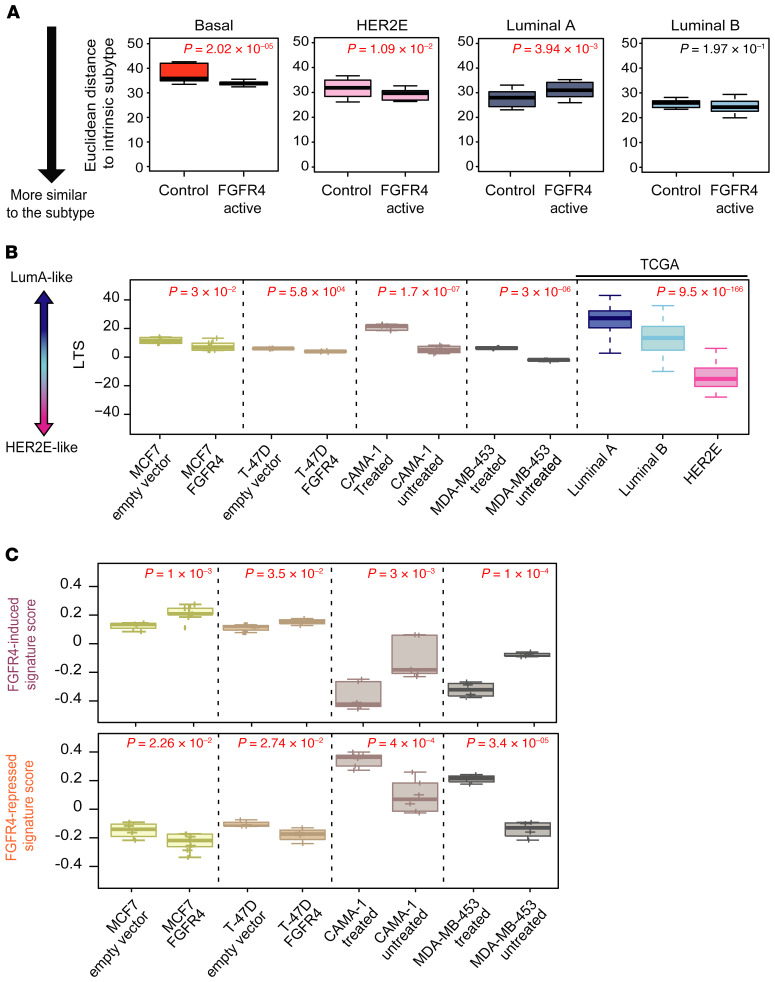
Figure 3. Testing FGFR4-associated signatures in genetically engineered or chemically inhibited breast cancer cell lines.
(A) Box-and-whisker plots depicting the Euclidean distance of each group of cell lines to the UNC337 tumor-intrinsic subtypes. Lower Euclidean distance suggests higher similarity to the subtype call. (B) Analysis of luminal tumor score (LTS) in each cell line tested along with TCGA grouped according to intrinsic subtype. (C) Average expression (signature score) of FGFR4-induced signature and FGFR4-repressed signature of each cell line described in A and B. Comparisons between 2 groups were performed by 2-tailed t test. Comparison between more than 2 groups was performed by ANOVA. Box-and-whisker plots display the median value on each bar, showing the lower and upper quartile range of the data and data outliers. The whiskers represent the interquartile range. Each mark represents the value of a single sample. Statistically significant values are highlighted in red.

