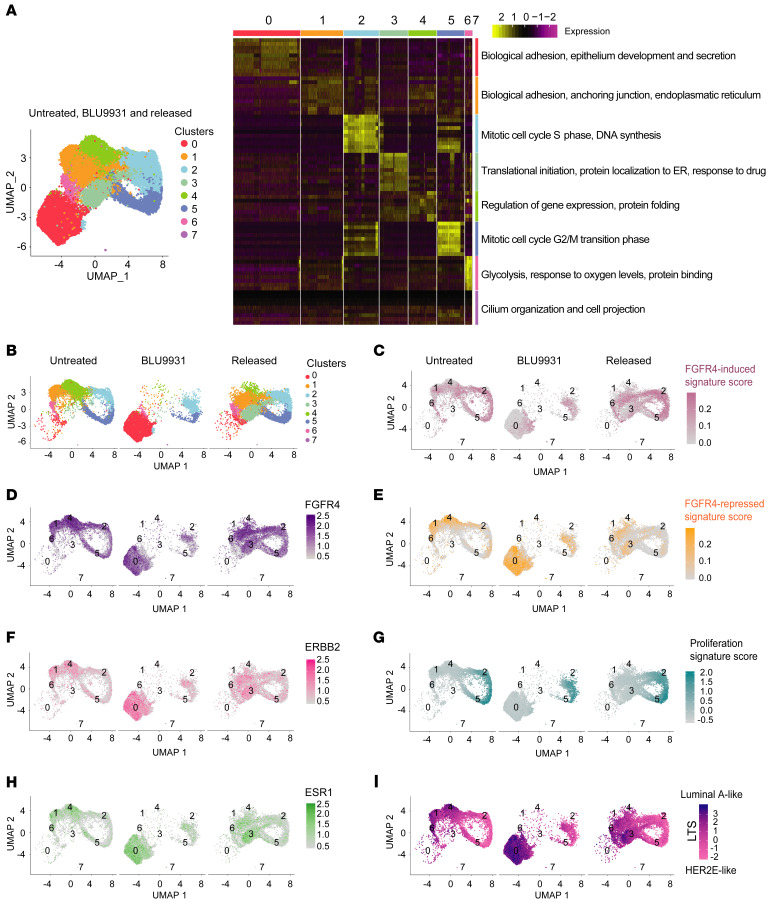
Figure 4. Single-cell RNA sequencing of WHIM11 tumor treated with BLU9931 and drug released.
(A) Left panel: Uniform manifold approximation and projection (UMAP) plot of all combined cells (30,058 cells in total) that passed quality checks in untreated WHIM11 (n = 2; 9298 cells), treated with BLU9931 (n = 2; 9777 cells) (0.6 g/kg/day) for 14 days, and treated but released of drug for 18 days (n = 2; 10,983 cells). Cells and clusters are color coded by each cell population found. Right panel: Heatmap of significantly differentially expressed genes and main Gene Ontology annotations for each cluster in WHIM11 based on MSigDB. Significant genes were identified by Wilcoxon’s signed-rank t test. (B) UMAP plot of all the cells that passed quality checks in WHIM11 and divided by each experimental condition as untreated, treated with BLU9931 (0.6 g/kg/day) for 14 days, and treated but released of drug for 18 days. Cells and clusters are color coded by each cell population found. (D, F, and H) UMAP plots showing the expression of FGFR4, ERBB2, and ESR1 genes across all WHIM11 clusters in WHIM11 untreated, treated with BLU9931 (0.6 g/kg/day) for 14 days, and treated but released of drug for 18 days. (C, E, G, and I) UMAP plots showing the gene signature score (average values of genes present in each score respectively for each cell) of FGFR4-induced signature, FGFR4-repressed signature, proliferation signature, and luminal tumor score (LTS) across all WHIM11 clusters in WHIM11 untreated, treated with BLU9931 (0.6 g/kg/day) for 14 days, and treated but released of drug for 18 days.

