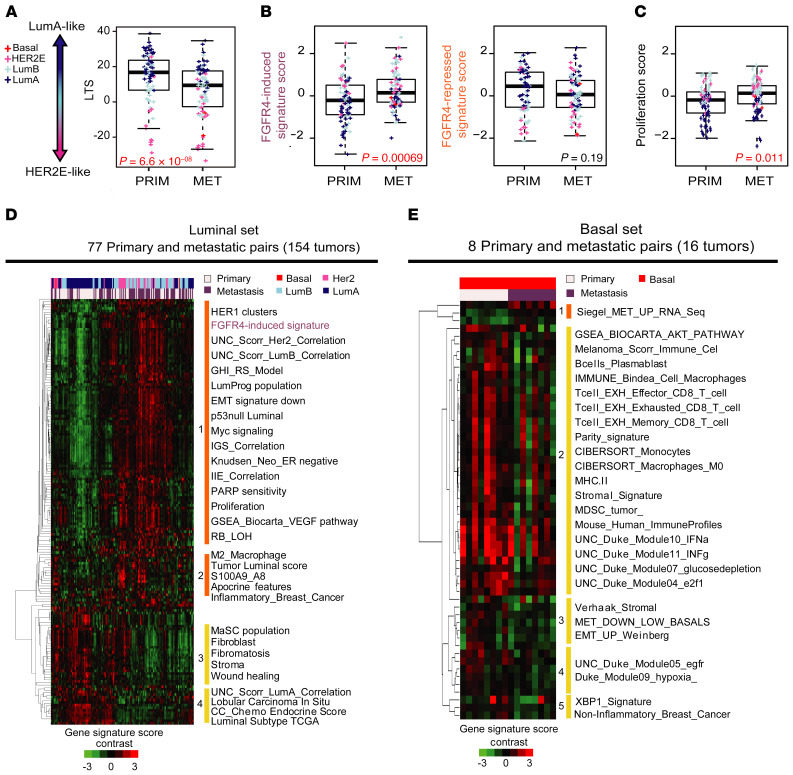
Figure 6. Expression profile and FGFR4-associated signatures in matched breast primary tumors and metastases.
(A) Luminal tumor score (LTS) calculated values in 77 primary and 77 paired metastatic tumors in the luminal set. (B) Expression levels of FGFR4-induced (left) and FGFR4-repressed signatures (right) in 77 primary and 77 paired metastatic luminal tumors. (C) Proliferation scores for FGFR4-induced and -repressed signatures (see PAM50 subtype classification in Methods) in 77 primary and 77 paired metastatic luminal tumors. (D) Supervised hierarchical cluster analysis derived from the significantly different modules scores, in luminal and (E) basal sets. Significance of the differences between modules was calculated using 2-class SAM at an FDR of 0%. Significantly up- and downregulated modules are clustered together for each set (basal and luminal). Clusters (4 from luminal and 5 from basal set) were selected based on node correlation greater than 0.5. Comparisons between 2 paired groups were performed by paired, 2-tailed t test. Statistically significant values are highlighted in red. Box-and-whisker plots display the median value on each bar, showing the lower and upper quartile range of the data and data outliers. The whiskers represent the interquartile range. Each mark represents the value of a single sample. LumA, luminal A; LumB, luminal B; PRIM, primary tumor; MET, metastatic tumor.

