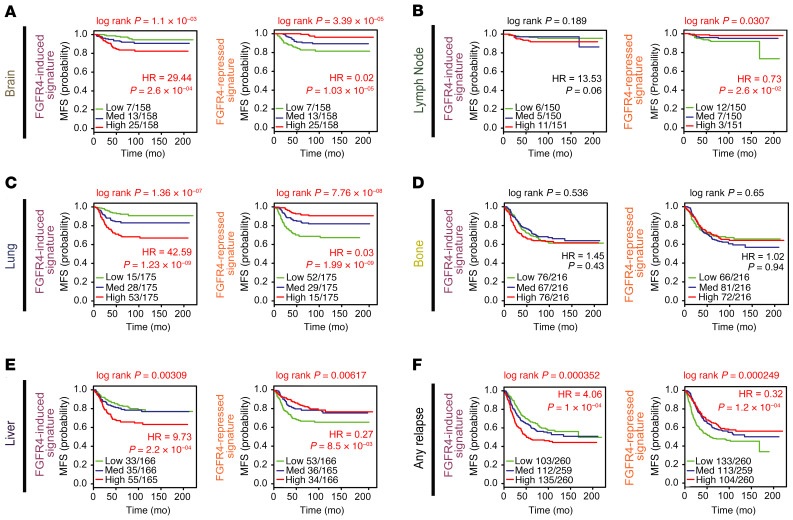
Figure 7. Univariate analysis in 855 primary tumors with known first site of relapse.
Kaplan-Meier and Cox proportional hazards model analyses of metastasis-free survival (MFS) analyzed in their specific sites of relapse: brain (A), lymph node (B), lung (C), bone (D), liver (E), or any site of relapse (F). Survival curve differences were calculated by the log-rank test and the estimates of survival probabilities and cumulative hazards with a univariate Cox proportional hazards model. FGFR4-derived signatures were evaluated as continuous variables and rank ordered according to the gene FGFR4 signature scores (induced and repressed) in 3 different levels: low, medium, and high (assigned by distribution in a given upper, middle, or lower tertile). Hazard ratio (HR) = 1: no effect. HR < 1: reduction in the hazard. HR > 1: increase in hazard. Statistically significant values are highlighted in red.

