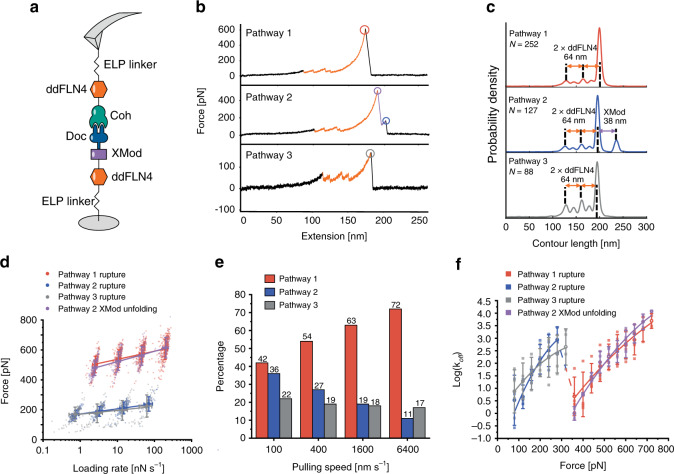
Fig. 2. XMod-Doc:Coh unbinds along three pathways under mechanical load.
a Experimental configuration with Coh-ddFLN4-ELP immobilized on the AFM tip and ELP-ddFLN4-XMod-Doc immobilized on the surface. Immobilization was site-specific and covalent through a terminal ybbR tag on the ELP. b Three different classes of force curves were repeatedly observed, corresponding to different pathways. In pathway 1 (P1), the complex ruptured at high force (500–600 pN, red circle) with the XMod remaining folded. In pathway 2 (P2), XMod unfolded (purple circle) followed by a low force rupture of the complex (blue circle). In pathway 3 (P3), the complex ruptured at low force rupture (gray circle) with the XMod remaining folded. Unfolding of the two ddFLN4 fingerprint domains (orange) was used to identify single-molecule traces. c Combined contour length histograms for each unbinding pathway. Force-extension traces were transformed using a freely rotating chain elasticity model and aligned using cross-correlation analysis. Histograms show contour length increments resulting from unfolding of 2× ddFLN4 and XMod. d Rupture force vs. loading rate plot showing final XMod-Doc:Coh complex rupture events obtained from the three pathways, as well as XMod unfolding events observed in P2. Error bars represent the standard deviation of rupture forces and loading rate (n = 74-317). Lines show linear Bell–Evans fits of the most probable rupture/unfolding force vs. logarithm of loading rate to obtain Δx‡ and k0 (Eq. (2)). Fitted Δx‡ and k0 values are listed in Table 1. e Percentages of the three pathways in all rupture events at different pulling speeds. f Kinetic off-rate (koff) vs. force for complex rupture and XMod unfolding events. Force-dependent off-rates calculated using the histogram transformation method (Eq. (3)) were plotted against force (shown in boxes). The average off-rates of four different pulling speeds were shown in open circles and fitted to the analytical expression (Eq. (5)) with υ = 0.5. Error bars represent the standard deviation of off-rate (n = 2–4). The fitted Δx‡, ΔG‡, and k0 values are listed in Table 1.

