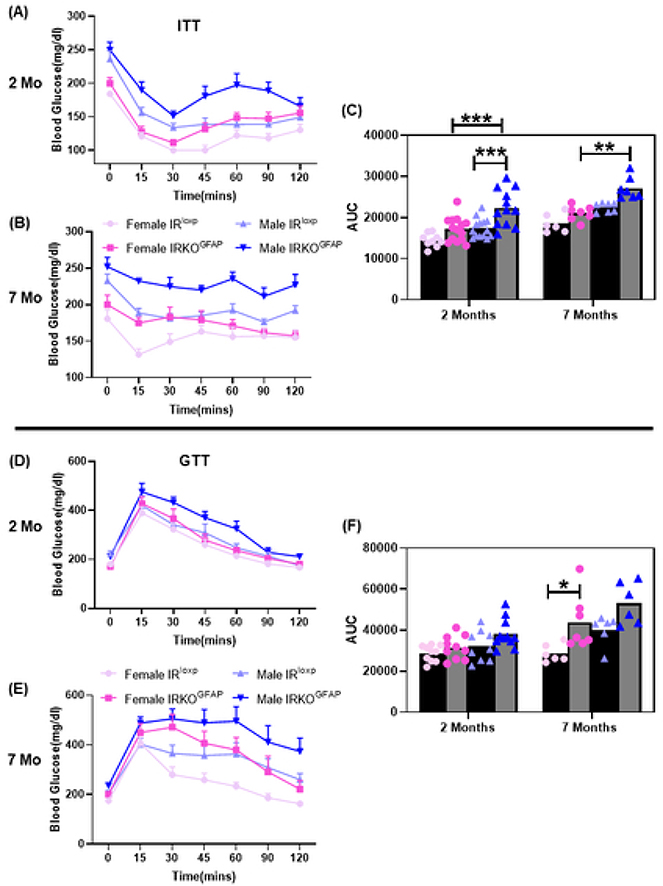
Figure 1. IRKOGFAP mice exhibit sex differences in insulin sensitivity and glucose tolerance over time.
(A) Insulin tolerance test (ITT) measurements of blood glucose levels for females (n=9–14 per group) and males (n=9–13 per group) after peripheral insulin injections (0.75U/kg IP) at 2 months of age. (B) ITT measurements of blood glucose levels for females (n= 6–8 per group) and males (n=7 per group) after peripheral insulin injections at 7 months of age. (C) Area under curve (AUC) measurements of ITT for females and males at 2 months and 7 months of age. (D) Glucose tolerance test (GTT) measurements of blood glucose levels for females (n=10 per group) and males (n=9–11 per group) after peripheral glucose injection (2g/kg) at 2 months of age. (E) GTT measurements of blood glucose levels for females (n=6–8 per group) and males (n=7 per group) after peripheral glucose injection at 7 months of age. (F) Area under curve (AUC) measurements of GTT for females and males at 2 months and 7 months of age. The female IRloxp group is represented with light pink line/dots, female IRKOGFAP group with dark pink line/dots, male IRloxp group with light blue line/dots and male IRKOGFAP group with dark blue line/dots. Values are expressed as means ± SEM. * P<0.0332, * * P<0.0021, *** P<0.0002, **** P< 0.0001 by three-way ANOVA and Tukey post-hoc test relative to IRKOGFAP versus IRloxp groups.

