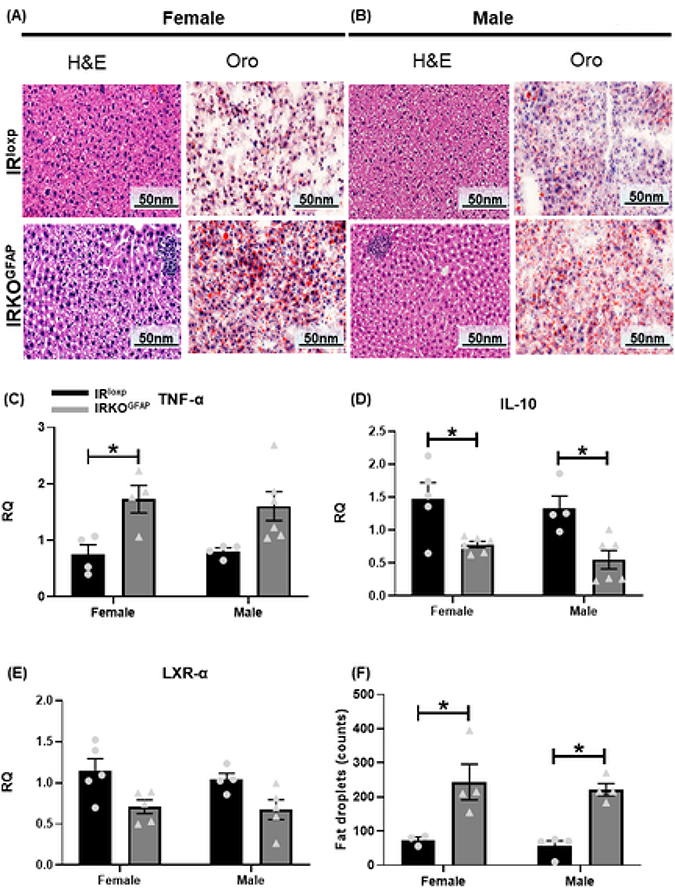
Figure 2. IRKOGFAP mice exhibit alterations in liver morphology and inflammation at 7–8 months of age.
(A-B) Histological H&E and ORO analysis of liver sections in females (n=3–4 per group) and males (n=4 per group). (C) Quantification of RT-PCR data showing fold change (RQ=2−ΔΔCt) in TNF-α mRNA expression in female and male mice (n=4 for females and 4–6 for males). (D) Quantification of RT-PCR data showing fold change in IL-10 mRNA levels in females and males (n=4–5 for females and 4–6 for males). (E) Quantification of RT-PCR data showing fold change in LXR- α mRNA expression in females and males (n=5 for females and 4–5 for males). (F) Quantitative analysis of fat droplets in liver tissues of female and males mice (n=3 per group). Female IRloxp group is represented with black bar/circle dots, female IRKOGFAP group with dark grey bar/triangle dots, male IRloxp group with black bar/circle dots and male IRKOGFAP group with dark grey bar/triangle dots. Values are expressed as means ± SEM. * P<0.0332, * * P<0.0021, *** P<0.0002, **** P< 0.0001 by two-way ANOVA and Tukey post-hoc test relative to IRKOGFAP versus IRloxp groups.

