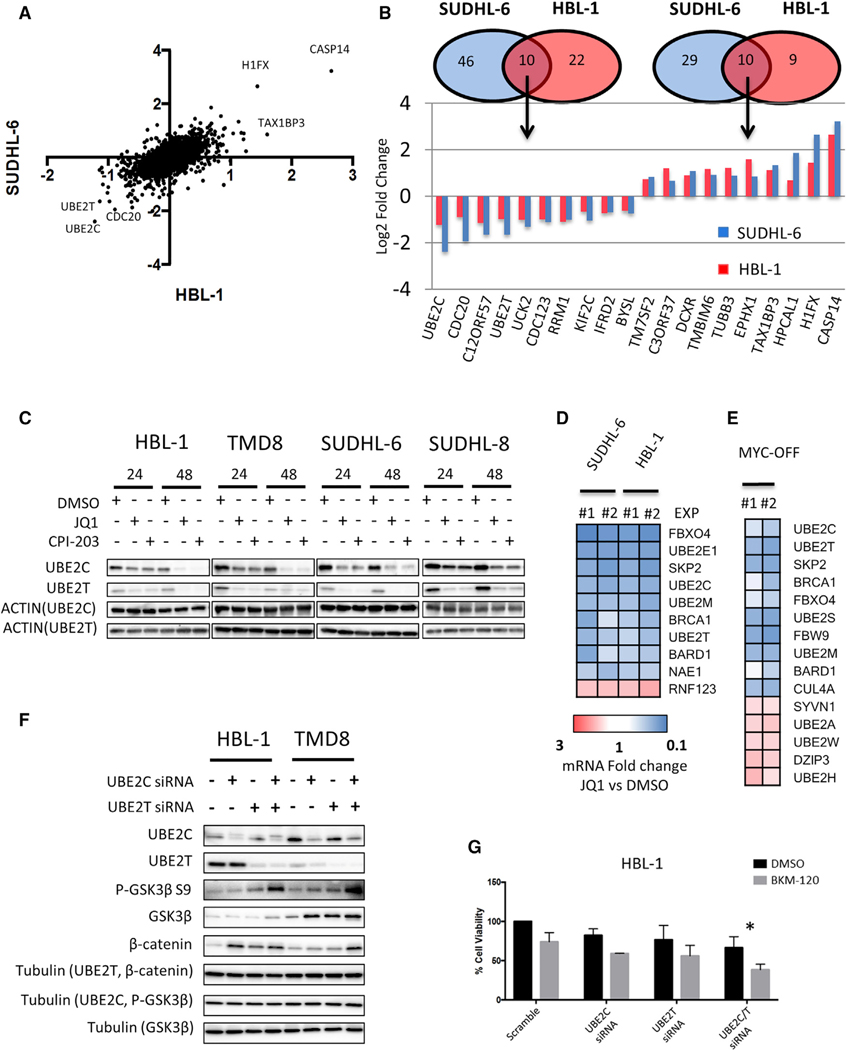
Figure 6. BETi-Mediated Regulation of the Ubiquitin System.
(A) Scatterplot of quantitative proteomics data showing protein changes in HBL-1 (x axis) and SUDHL6-cells (y axis) in a log2 scale. Average log2 fold change of one forward and reverse experiment in HBL-1 and SUDHL-6 cells were used to generate the scatterplot. See also Figure S6A and Data S2.
(B) Venn diagram showing overlap of significantly up and downregulated proteins in HBL-1 (red) and SUDHL-6 cells (blue), and bar graph showing fold change in the top 10 commonly up- and downregulated proteins in HBL-1 (red) and SUDHL-6 cells (blue).
(C) Representative western blot showing marked decrease in UBE2C and UBE2T protein levels in 4 representative cell lines after 24 and 48 hr of incubation with 0.5 μM JQ1.
(D) Effects of JQ1 (0.5 μM for 24 hr) on ubiquitination pathways gene expression in HBL-1 and SUDHL-6 cells, as determined by PCR pathway-directed array. Genes commonly regulated in HBL-1 and SUDHL-6 cells by at least ±1.5-fold change are shown. Fold change values of JQ1-treated cells versus DMSO obtained in 2 independent experiments are represented in a colorimetric scale from blue (low) to red (high). See also Figure S6B.
(E) Significantly regulated ubiquitination pathway genes (at least ±1.5-fold change) in P-4936 cells treated with doxycycline (1 μg/mL) (MYC-OFF) for 24 hr, as detected by PCR pathway-directed array. Fold change values obtained in 2 independent experiments are represented in a colorimetric scale from blue (low) to red (high).
(F) Representative western blot showing the effects of UBE2C, UBE2T, and combined UBE2C plus UBE2T silencing on GSK3β/β-catenin axis in lymphoma cells (2 ABC-derived DLBCL cell lines [TMD8 and HBL-1]) at 48 hr.
(G) Bar graphs showing the antiproliferative effects of Scramble, UBE2C, UBE2T, and combined UBE2C/T siRNAs plus or minus BKM-120 in HBL-1 cells. Combined UBE2C/T silencing significantly enhanced the antiproliferative effect of the PI3K inhibitor BKM-120 (0.5 μM) at 48 hr. Error bars represent SEM of triplicate experiments. Differences between groups were calculated with the Student’s t test. *p < 0.05, **p < 0.01.

