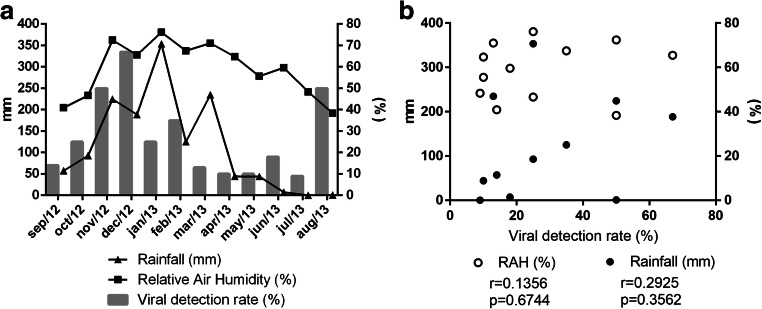
Fig. 3.
a Distribution of viral detection rates during 12 months of study. Positivity rates (percentages) were plotted against rainfall and relative air humidity (RAH). Left y axis: rainfall (mm). Right y axis: percentages. b Association between viral detection rates and meteorological parameters was analyzed using Pearson correlations. Both “p” and “r” values are indicated in the graph for each variable analyzed

