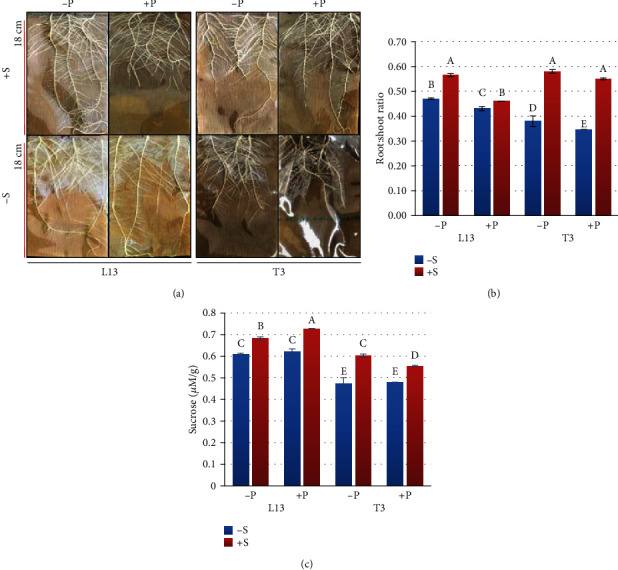
Figure 1.

(a) Root physiological responses, (b) root : shoot ratio, and (c) root sucrose content of L13 and T3 soybean genotypes grown under P starvation (-P) and normal P (+P) levels fed with (+S) or without (-S) exogenous sucrose application. The error bars represent standard deviation, and the different letters on the bars show significantly different values.
