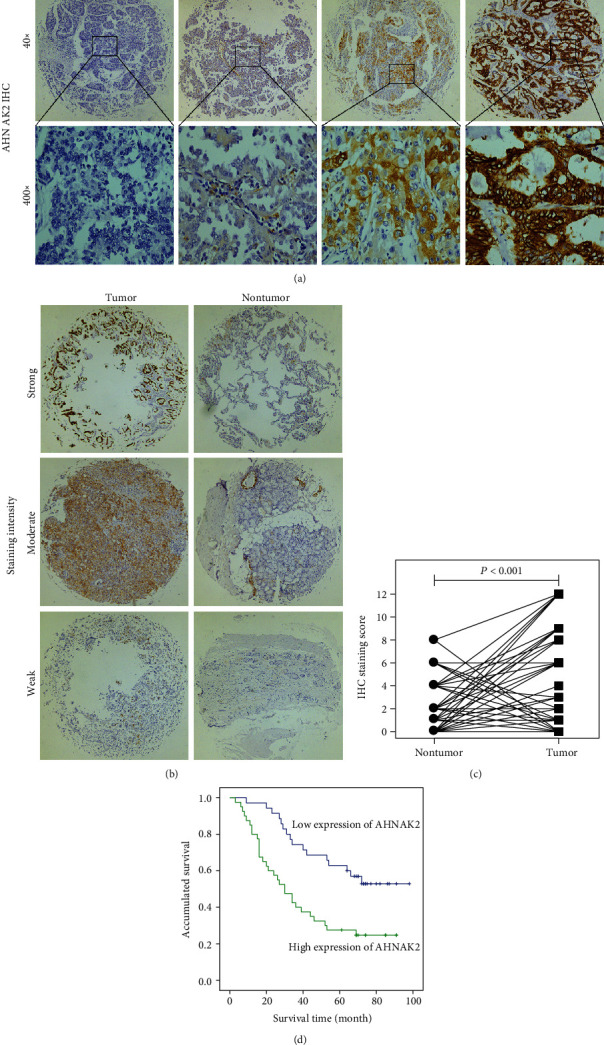
Figure 1.

Immunohistochemical analysis of the expression of AHNAK2 in LUAD specimens. (a) Representative staining intensity images of AHNAK2 in tumor samples(40x: 40 times magnification, 400x: 400 times magnification). (b) Representative pictures of AHNAK2 with different staining intensities in tumor tissues compared with adjacent normal tissues. (c) The paired difference plot showed that AHNAK2 was highly expressed in ADC tissues (P < 0.05 was considered to be statistically significant). (d) Kaplan–Meier survival curve revealed that high AHNAK2 expression was significantly correlated with poor prognosis.
