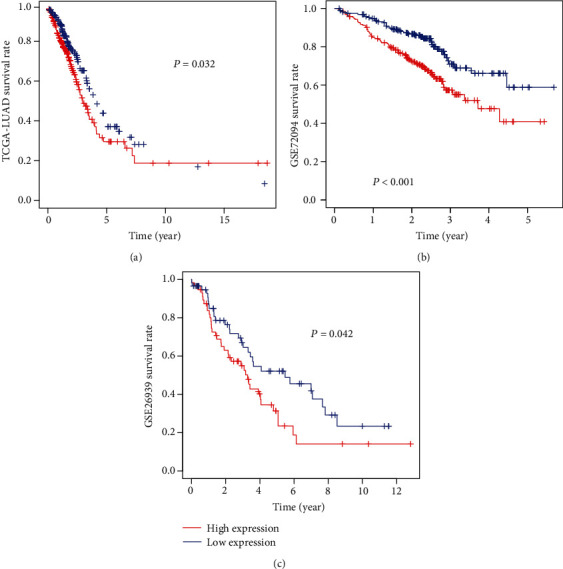
Figure 3.

Kaplan–Meier survival curves for high AHNAK2 expression versus low AHNAK2 expression. (a) High AHNAK2 expression was significantly associated with poor overall survival in the TCGA-LUAD cohort (P = 0.032, samples number (n) = 477). (b) High AHNAK2 expression was significantly correlated with poor prognosis in the GSE72094 dataset (P < 0.001, n = 386). (c) High AHNAK2 expression was associated with poor OS in the GSE26939 cohort (P = 0.042, n = 115).
