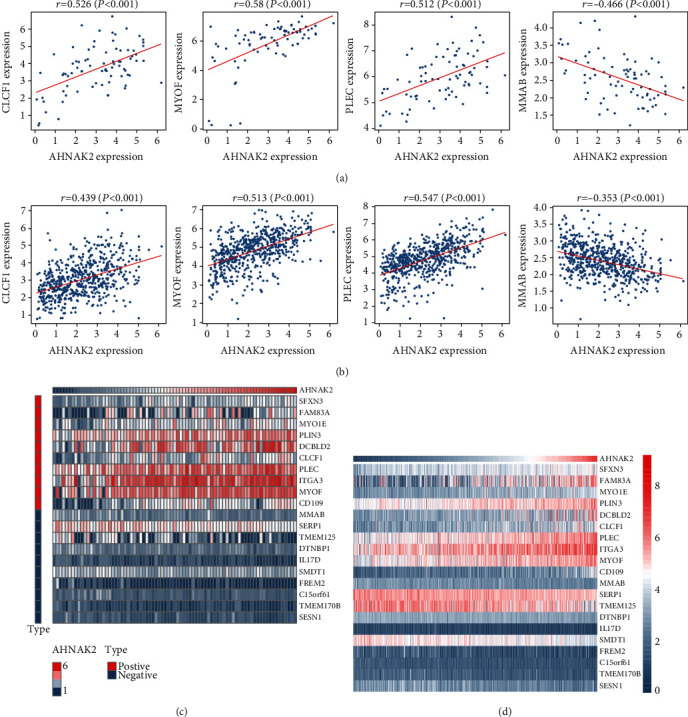
Figure 6.

Relation genes of AHNAK2 in CCLE-LUAD cell lines and TCGA-LUAD. (a) Several related genes in CCLE-LUAD cell lines were shown in Pearson's correlation analysis chart (r: correlation coefficient, P < 0.05 was considered to be statistically significant). (b) Several related genes in TCGA-LUAD were shown in Pearson's correlation analysis chart. (c) Heatmaps showed the expression relationship of several representative genes with AHNAK2.
