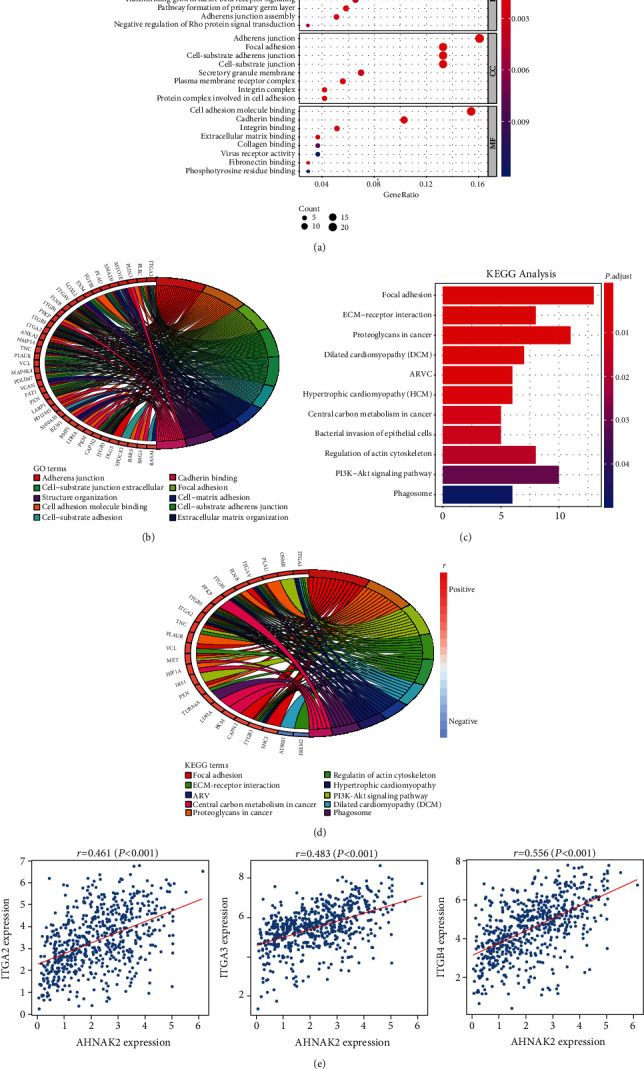
Figure 7.

Functional enrichment analysis of AHNAK2 in ADC. (a) GO analysis of the 148 genes showed that AHNAK2 was closely correlated with adhesion function in LUAD. (b) Circle chart revealed ten GO functions of the most enrichment gene numbers, most of which were closely related to adhesion. (c) Bar chart showed the enrichment pathways of KEGG analysis. Focal adhesion, ECM-receptor interaction, and proteoglycans in cancer suggested the best optimal correlation with AHNAK2. (d) The circle chart showed ten most relevant enrichment pathways, including focal adhesion and ECM-receptor interaction. Meanwhile, the chart revealed the corresponding relationship of the gene signatures with signal pathways. (e) AHNAK2 was closely related to several integrin family molecules (ITGA2, ITGA3, and ITGB4), which play an important role in ECM-receptor interaction and focal adhesion formation (r: correlation coefficient, P < 0.05 was considered to be statistically significant).
