
Figure 5.
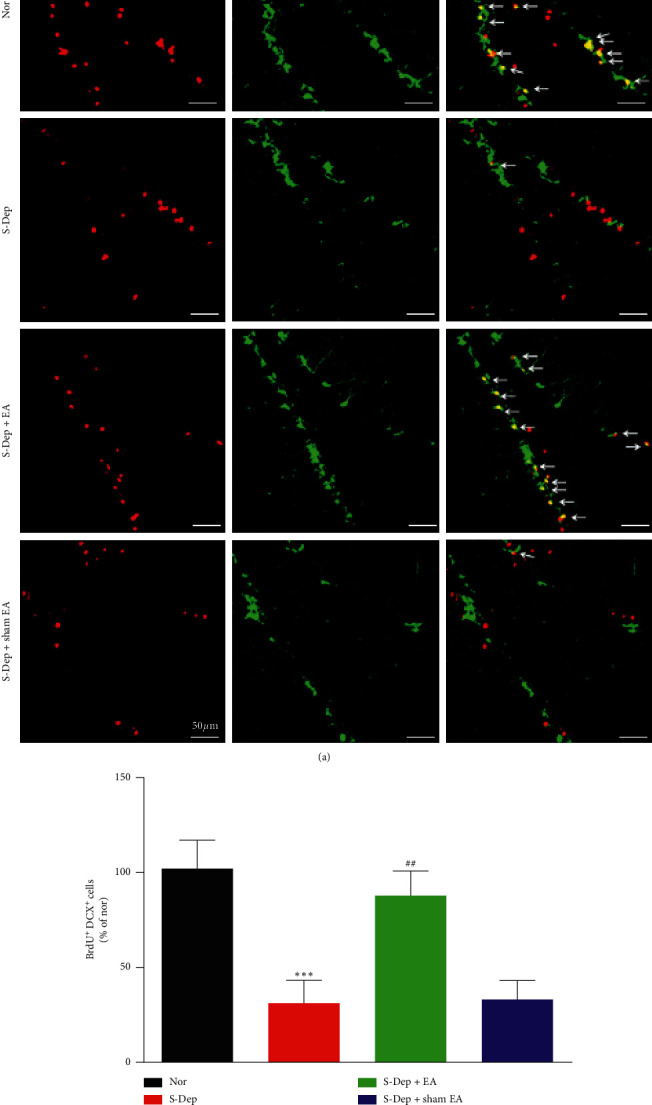
EA alleviated neuron progenitor cell proliferation in the DG of hippocampus. (a) Representative microphotograph of BrdU (red) and DCX (green) double immunostaining showing immature neurons in the DG. (b) Quantification of BrdU and DCX double positive cells (yellow). Data were presented as the mean ± SD, n = 6; ∗∗p < 0.01 vs. normal group; ##p < 0.01 vs. sleep deprivation group.