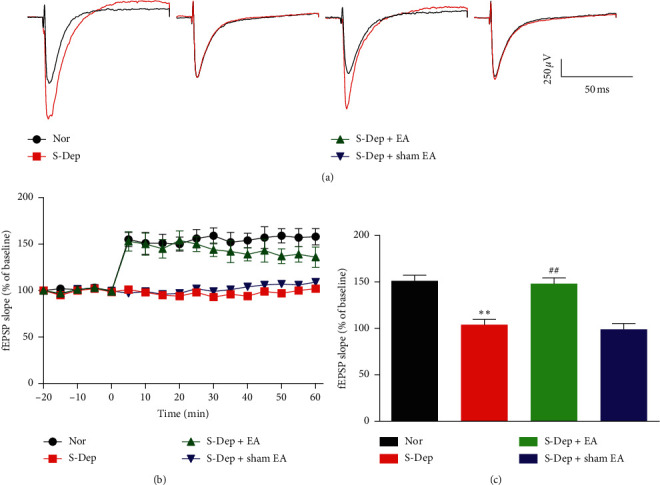
Figure 6.

EA abolished LTP impairment induced by S-Dep. (a) Representative traces of the fEPSPs in the CA1 region of hippocampus before and after HFS in the Schaffer collaterals. (b) Plot of fEPSPs slope values as a percentage of baseline. (c) fEPSPs slope values were averaged from the duration 50–60 min after HFS. Data were presented as the mean ± SD, n = 8; ∗∗p < 0.01 vs. normal group; ##p < 0.01 vs. sleep deprivation group.
