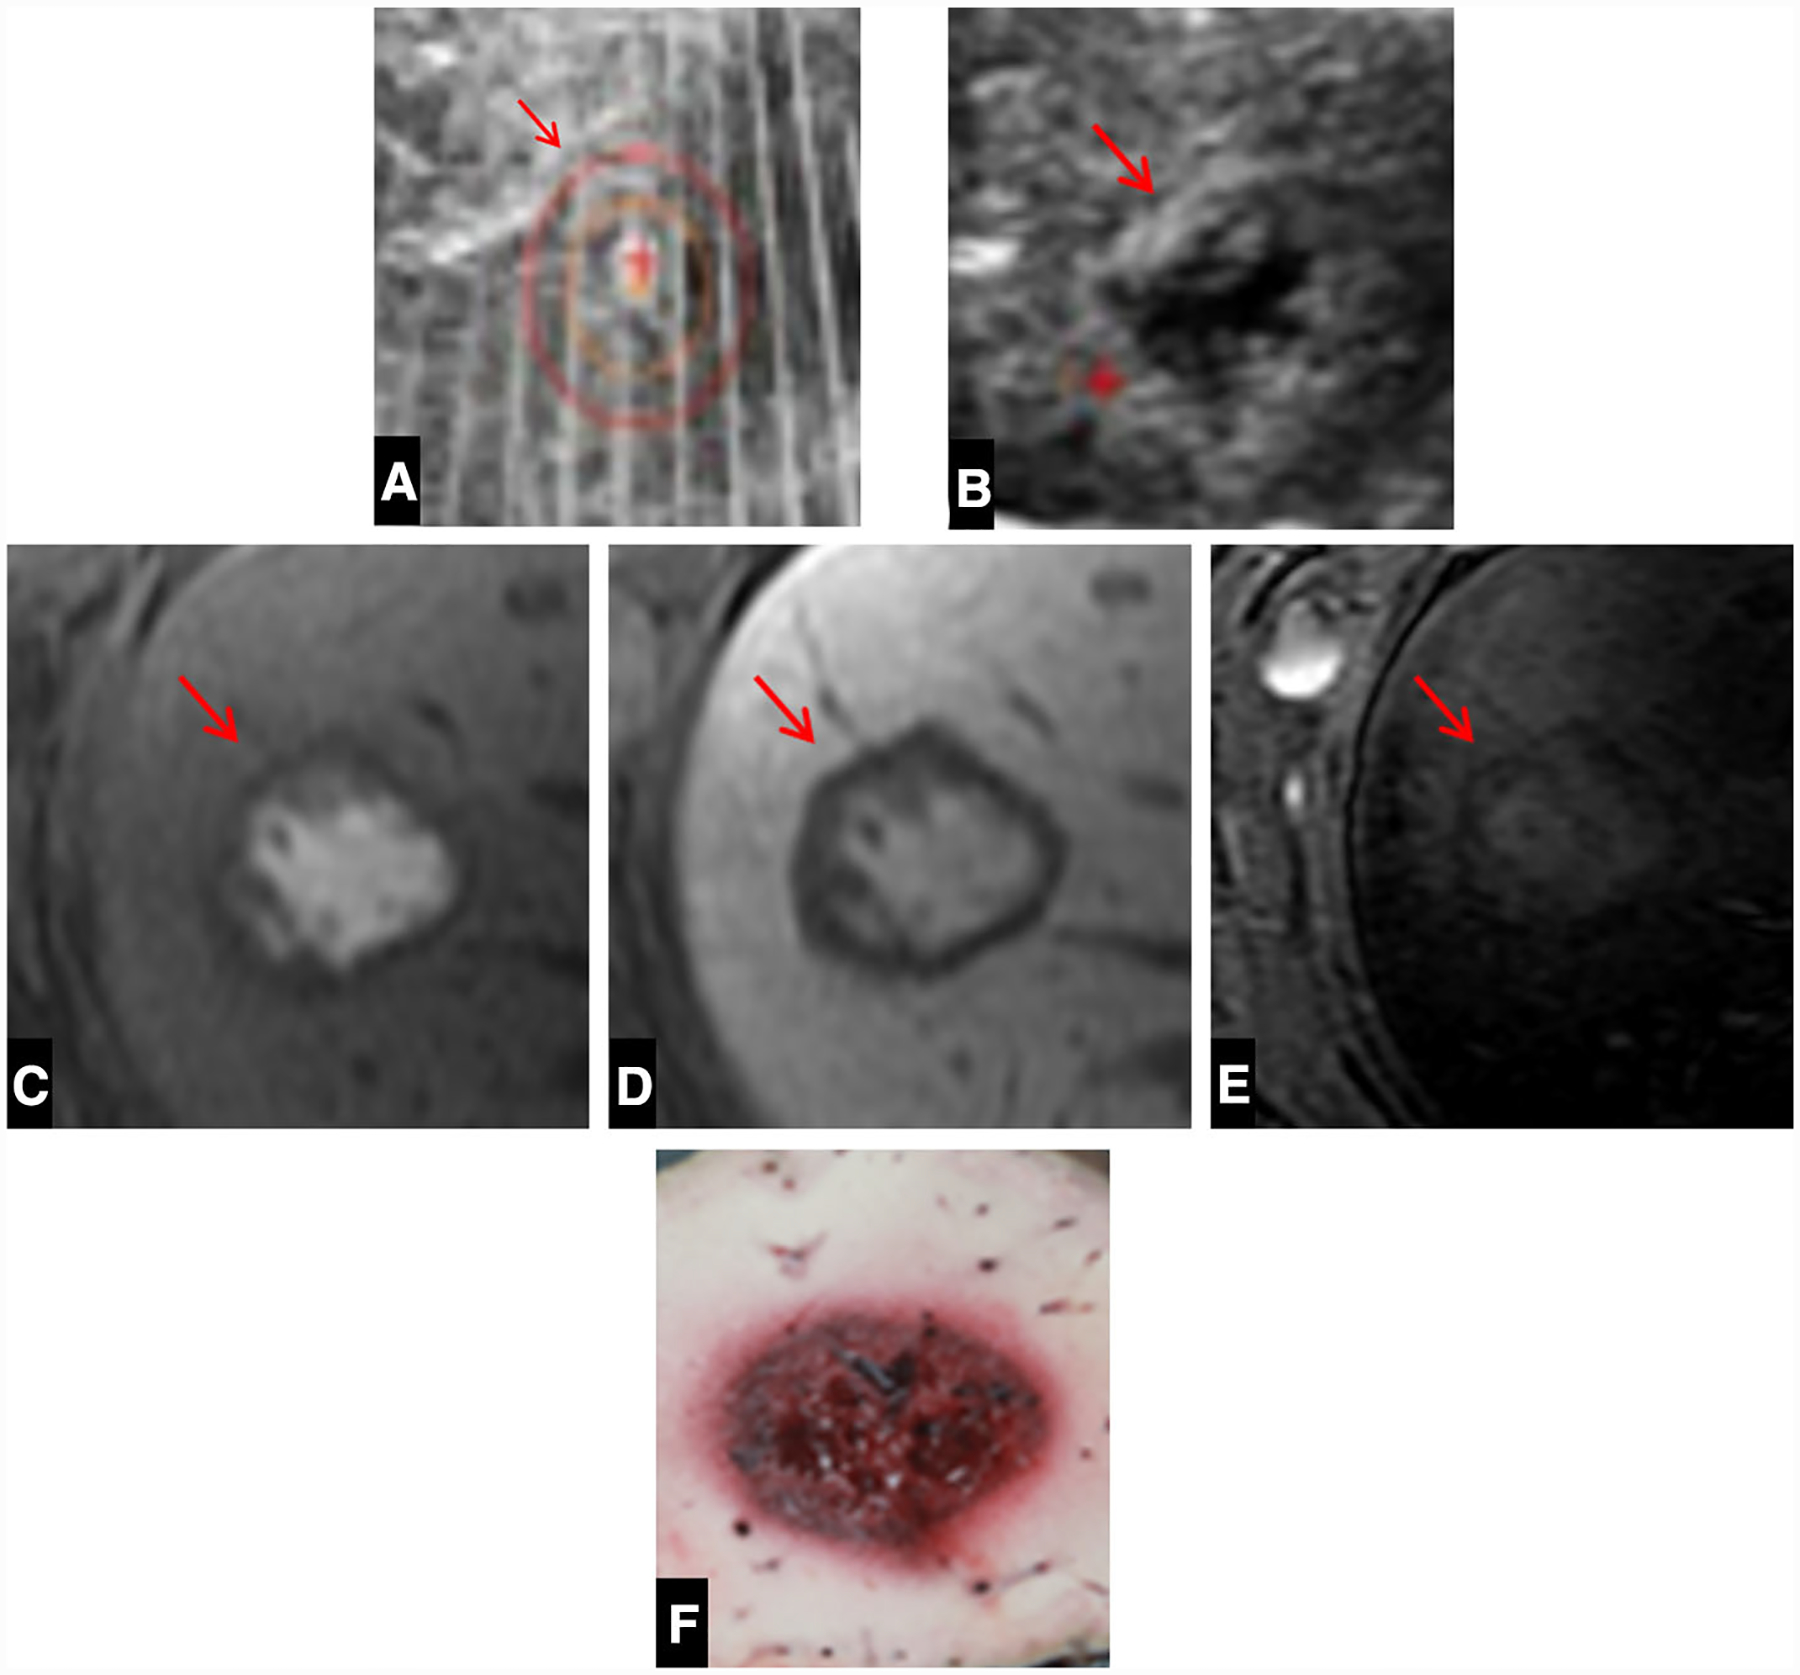
Fig. 1. A.

A Intra-procedural ultrasound image demonstrating the bubble cloud (arrow) within the right hepatic lobe. B Corresponding immediate post-procedure image shows the hypoechoic ablation zone (arrow). C Axial T1 pre-contrast images demonstrate a well-demarcated ablation zone (arrow) containing high-signal-intensity blood products. D Axial T1 post-contrast portal venous phase MRI image with no enhancement. E Axial STIR image demonstrates no evidence of body wall edema or injury. F Corresponding gross pathologic specimen of the liver with a well-demarcated ablation zone without damage to the surrounding liver. The thin area of light red tissue surrounding the ablation zone corresponds to the transition zone
