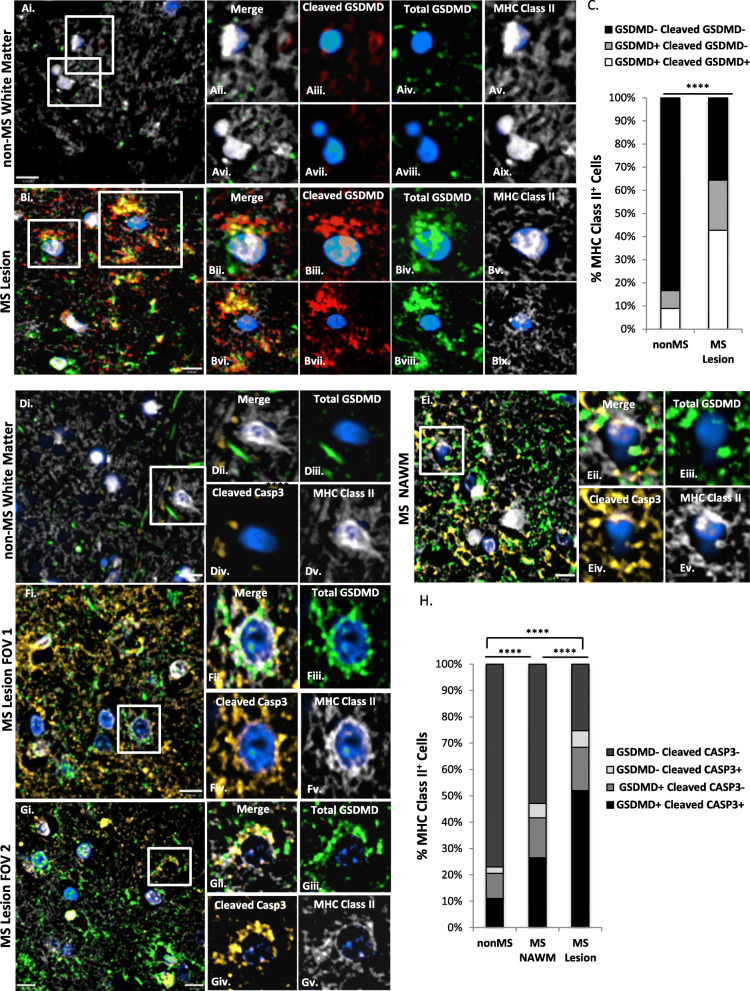
Fig. 1.
Macrophages/microglia in MS lesions co-express cleaved GSDMD and cleaved caspase-3. (a, b) Autopsied brain tissue sections from non-MS patients with neuropathologically normal brains (nonMS white matter; a) and MS patients with white matter lesions (b) were immunolabelled for cleaved GSDMD (red), total GSDMD (green), and MHC class II (white) and imaged using confocal microscopy (representative images are shown). (c) Each MHC class II+ cell was categorized as single-immunopositive, double-immunopositive, or double-immunonegative for total GSDMD and cleaved GSDMD based on mean fluorescence intensity (MFI), using a threshold of 3X background fluorescence. A total of n = 78 MHC class II+ cells from 10 unique fields of view (FOV) derived from the neuropathologically normal nonMS control were categorized; n = 295 MHC class II+ cells from 30 unique FOV derived from two MS patients were categorized. Distribution of cells within each of the three categories was significantly different between nonMS white matter and MS white matter lesions by Chi-square test (****p < 0.0001). Scale bar = 10 μm. (d–g) Autopsied brain tissue sections for nonMS (d) and MS patients (e–g) were immunolabelled for cleaved caspase-3 (amber), total GSDMD (green), and MHC class II (white) and imaged using confocal microscopy (representative images are shown). (h) MHC class II+ cells were categorized as single-immunopositive, double-immunopositive, or double-immunonegative for cleaved caspase-3 and GSDMD based on MFI using a threshold of 3X background fluorescence. A total of n = 209 MHC class II+ cells from 29 unique fields of view (FOV) derived from two neuropathologically normal nonMS controls were categorized; n = 223 MHC class II+ cells from 25 unique FOV derived from the normal-appearing white matter (NAWM) of two MS patients were also categorized, along with n = 554 MHC class II+ cells from 58 unique FOV within MS lesions. Distribution of cells within each of the four categories was significantly different between nonMS and both MS NAWM and MS lesions by Chi-square test (****p < 0.0001). Scale bar = 10 μm

