Fig. 8.
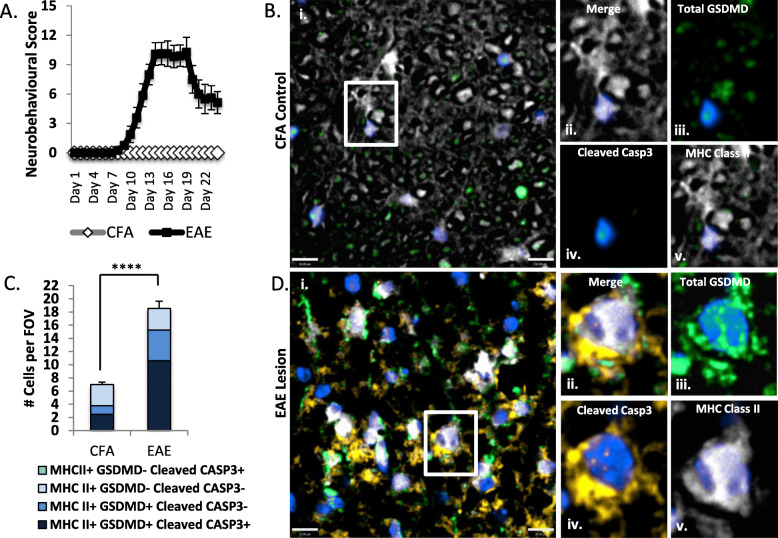
Macrophages/microglia co-express GSDMD and cleaved caspase-3 in the CNS during EAE: EAE was induced in C57/Bl6 female animals with CFA exposure as a control (n = 10 per group). Animals were sacrificed at 24 days post-induction of disease for morphological analyses. (A) Neurobehavioural outcomes in EAE and CFA-exposed animals, measured using a 15-point severity scale. (B–D) Spinal cord tissue sections from CFA-exposed (B) and EAE mice (D) were immunolabelled for cleaved caspase-3 (amber), total GSDMD (green), and MHC class II (white) and imaged using confocal microscopy (representative images are shown). (C) Each MHC class II+ cell was categorized as single-immunopositive, double-immunopositive, or double-immunonegative for total GSDMD and cleaved caspase-3 based on mean fluorescence intensity (MFI) using a threshold of 3X background fluorescence. A total of n = 224 MHC class II+ cells from 32 unique fields of view (FOV) were categorized from n = 4 CFA-exposed animals. A total of n = 630 MHC class II+ cells from 34 unique FOV derived from n = 4 EAE animals were categorized. Distribution of cells within each of the categories was significantly different between CFA control white matter and EAE white matter lesions by Chi-square test (****p < 0.0001). Scale bar = 10 μm

