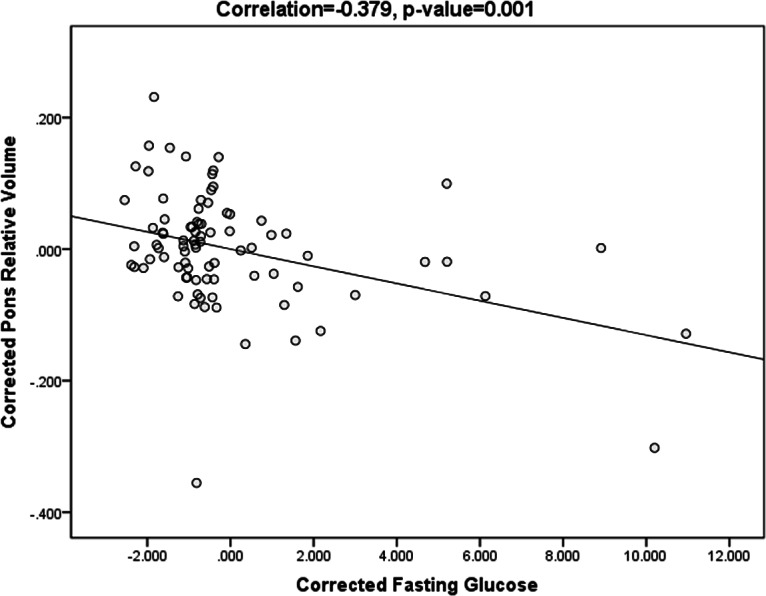
Figure 3. Scatter plots of pontine volume and fasting glucose level.

Scatter plots showing the negative correlation between pontine volume and fasting glucose level, after correcting for age, education level, MMSE, cholesterol, triglyceride, and blood pressure (r = − 0.379, p = 0.001).
