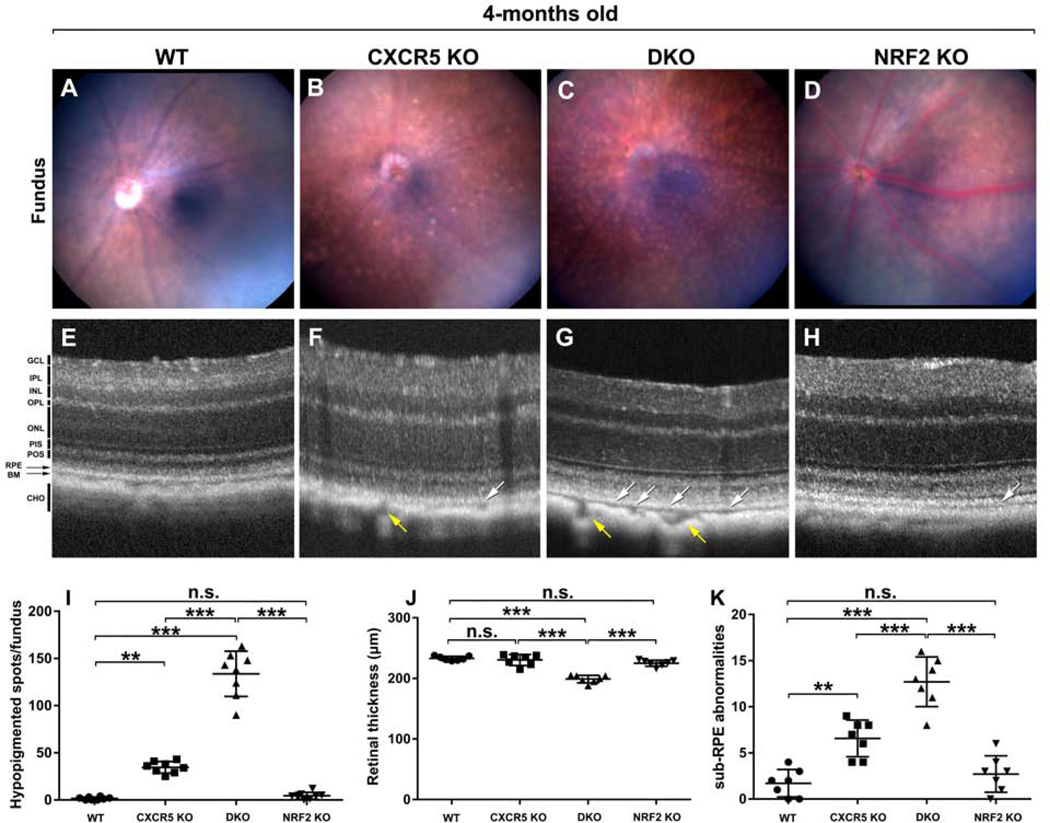
Figure 2.
Fundus and Optical Coherence Tomography evaluations. The representative fundus images C57BL/6 WT (A), CXCR5 KO (B), DKO (C), NRF2 KO (D). The representative OCT images C57BL/6 WT (E), CXCR5 KO (F), DKO (G), and NRF2 KO (H). White arrows indicate sub-RPE abnormalities; yellow arrows indicate enlarged choroidal vessels. The quantification of hypopigmented spots in the fundus images (G), retinal thickness (J), and of sub-RPE abnormalities (K) in the OCT data. The spots numbers on fundus images and the sub-RPE abnormalities were counted by “masked” observer and averaged from images acquired from 8 animals per group (n=8, fundus images); 7 animals per group (n = 7, OCT data). Retinal layers were denoted as follows. GCL - ganglion cell layer. IPL - inner plexiform layer. INL - inner nuclear layer. OPL - outer plexiform layer. ONL - outer nuclear layer. PIS - photoreceptor inner segment. POS - photoreceptor outer segment. RPE - retinal pigment epithelium. BM - Bruch’s membrane. CHO - choroid. P values were denoted: n.s. P > 0.05; *P < 0.05; **P < 0.01; ***P < 0.001.

