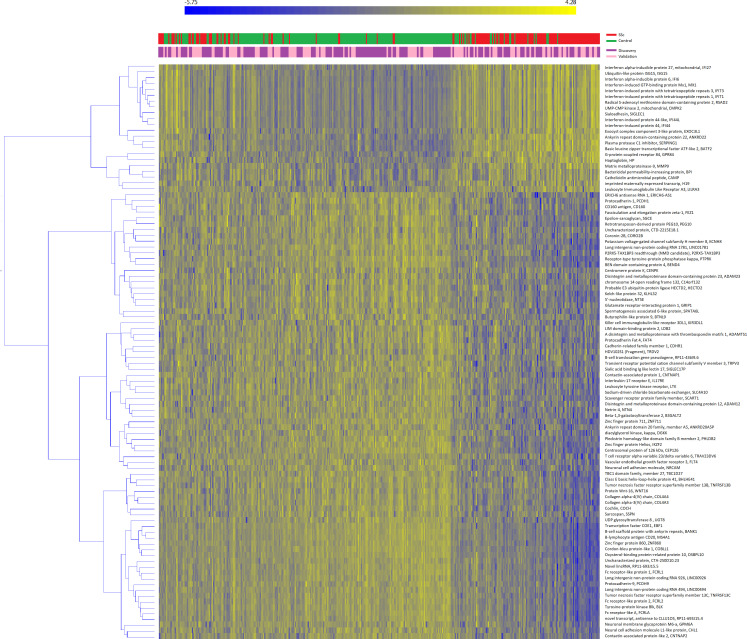
Figure 1.
Heatmap of validated genes. Heatmap representation of replicated genes in the discovery (purple) or validation (pink) sets. Patients (in red) and controls (in green) are clustered column-wise via the k-means algorithm, genes are clustered row-wise via the hierarchical clustering Ward method. Patient-wise data standardisation was applied before clustering.

